This week’s Market Insights start with a simple question: does Washington choose a deal or escalation in the Iran war? The Federal Reserve raised rates last week with inflation still too high and Middle East tension among its reasons, and now oil, bond yields and the dollar all wait on diplomacy. President Trump meets Gulf leaders at the United Nations on Tuesday and hosts China’s Xi Jinping on Thursday, while Houthi strikes on Saudi Arabia keep supply risks high. Below, our key market insights and data driven insights cover gold, oil, the major currency pairs and US stocks, so you can make informed decisions before the headlines land.
Quick Summary Box
The market mood is tense, not panicked: bonds are nervous, stocks are steady and oil is the swing factor. Gold holds a recovery range after snapping a losing streak, cautiously bullish while it stays above its medium-term averages. WTI crude has eased as Saudi Arabia works to restart its damaged pipeline, but stays bullish while Hormuz remains shut, making Tuesday’s Gulf meeting the driver. The S&P 500 is range-bound under its summer peak, with generative AI demand lifting chipmakers while high yields cap valuations. The dollar index sits near its strongest level since midsummer and stays bullish while Treasury yields hover near their highs. The euro and pound are soft, the yen and franc weak despite their haven label, and the Aussie leans on rate hike hopes. The latest trends point the same way: follow oil.
Asset Breakdown: Market Research on Global Markets
The analysis below combines live research, institutional commentary and fresh positioning data, the market insights that let you form a working view of each asset before the verdict lands.
XAUUSD (GOLD)
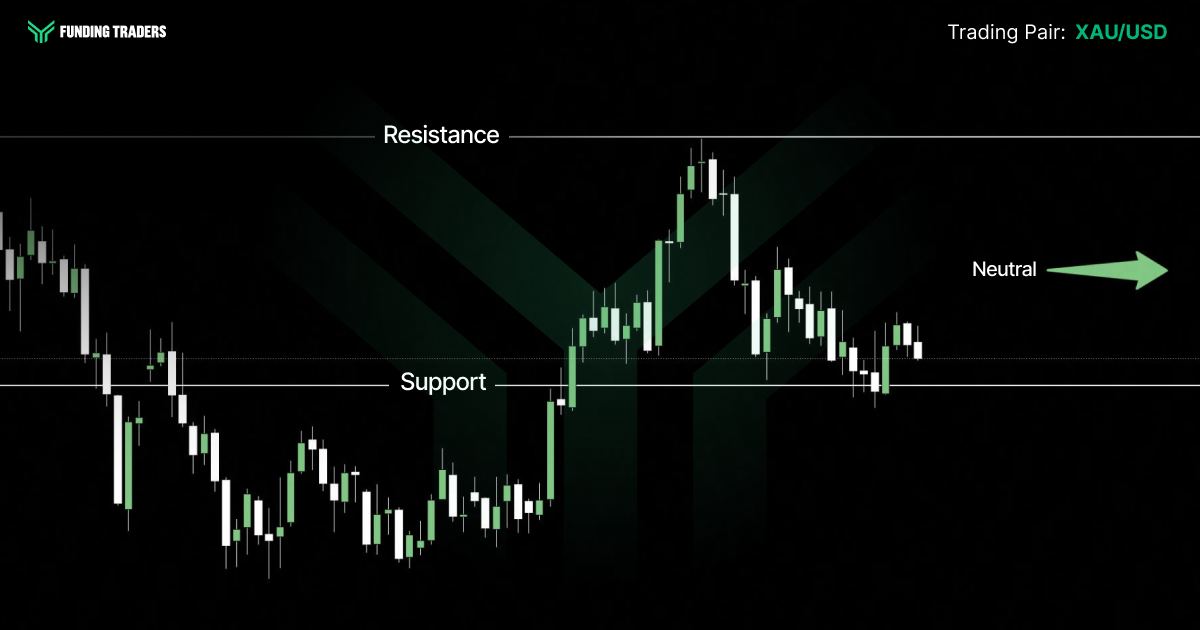
Gold fell early last week, then turned hard. It rebounded from a near six-week low on Wednesday to a one-week high of $4,380 on Friday, its first weekly gain in four weeks. It then eased to $4,370 on Monday as yields rose. The trigger was cheaper oil, which cooled inflation fears and forced short covering. That flips the usual relationships: gold is trading as a rates asset first and a war hedge second.
Support sits at the 100-day SMA ($4,320.72) and the 55-day ($4,273.00), while the 200-day ($4,541.17) caps the rebound, with August tops near $4,700 above. Speculative exposure sits in the 98.4th percentile, a crowded long where hedge funds can hit their risk limits and exit together. Bank research still leans higher: Goldman keeps a $4,900 year-end target, while warning that renewed hike bets could spark a sharper-than-usual correction. Bias: neutral to cautiously bullish.

EURUSD
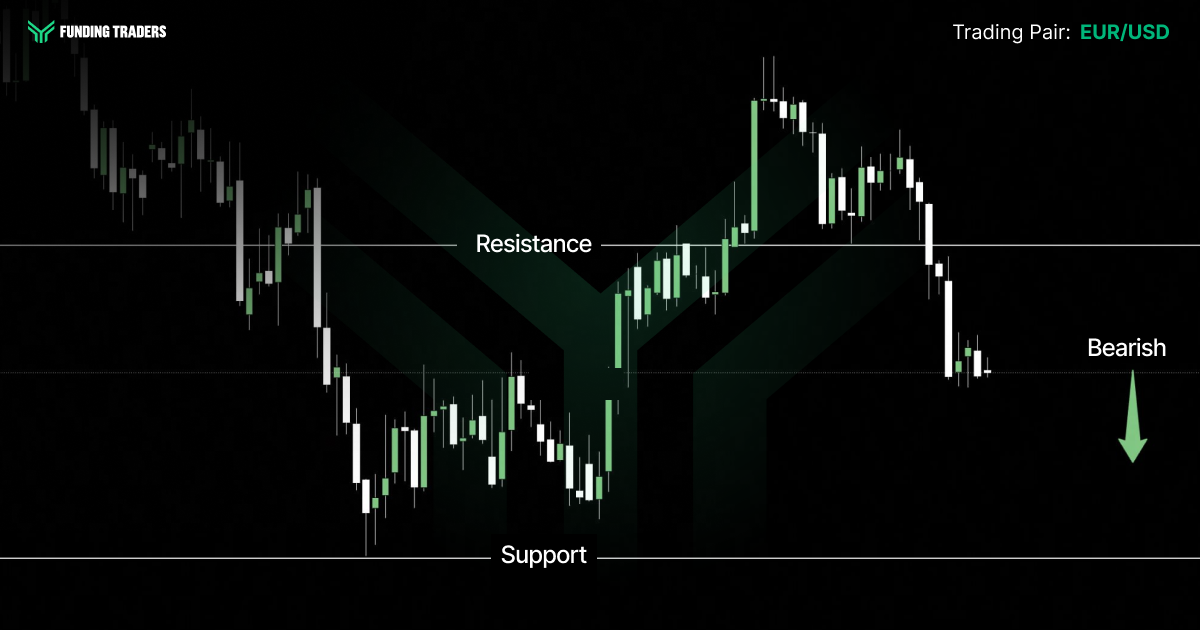
The euro sits at $1.1477 after losing almost 1% last week. The ECB hiked to 2.50% on 10 September, but the Fed’s hawkish turn still pulled money toward the dollar. Politics is piling on: Merz’s CDU posted its worst-ever state election result on Sunday, and the French risk premium hit its widest since the euro debt crisis.
For a better understanding of the chart, a break below 1.1453 opens 1.1323, while 1.1565 caps rebounds. ING trimmed its EUR/USD forecasts this month, cutting year-end to 1.16. Bias: bearish. Focus on Tuesday’s consumer confidence reading and Wednesday’s flash PMIs; firm business activity and a solid services print would slow the slide.
GBPJPY
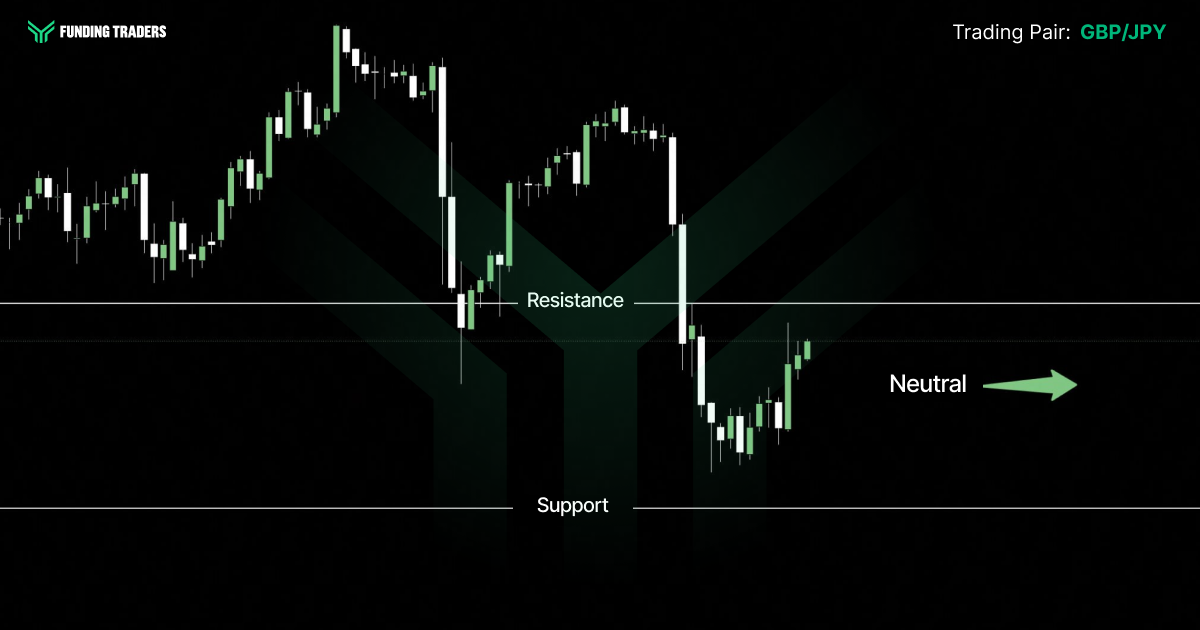
This cross is a tug of war between two central banks and one finance ministry. The BoE held at 3.75% on a 6-3 vote, but a dovish balance-sheet plan and the Fed’s hike left the pound near seven-week lows around 1.3365. The BoJ hiked to 1.25%, its highest since 1995, yet two dissents weakened the yen. Tokyo’s finance ministry is the third of the key players.
The pair bottomed at 207.06 and stalled at 211.25. A break higher targets 211.83 then 214.78, while a deeper drop could reach 206.10. Bias: neutral. The challenges run both ways, from intervention to soft UK data, so cut your lot size: this cross can respond violently when Tokyo reopens on Thursday.
USDJPY
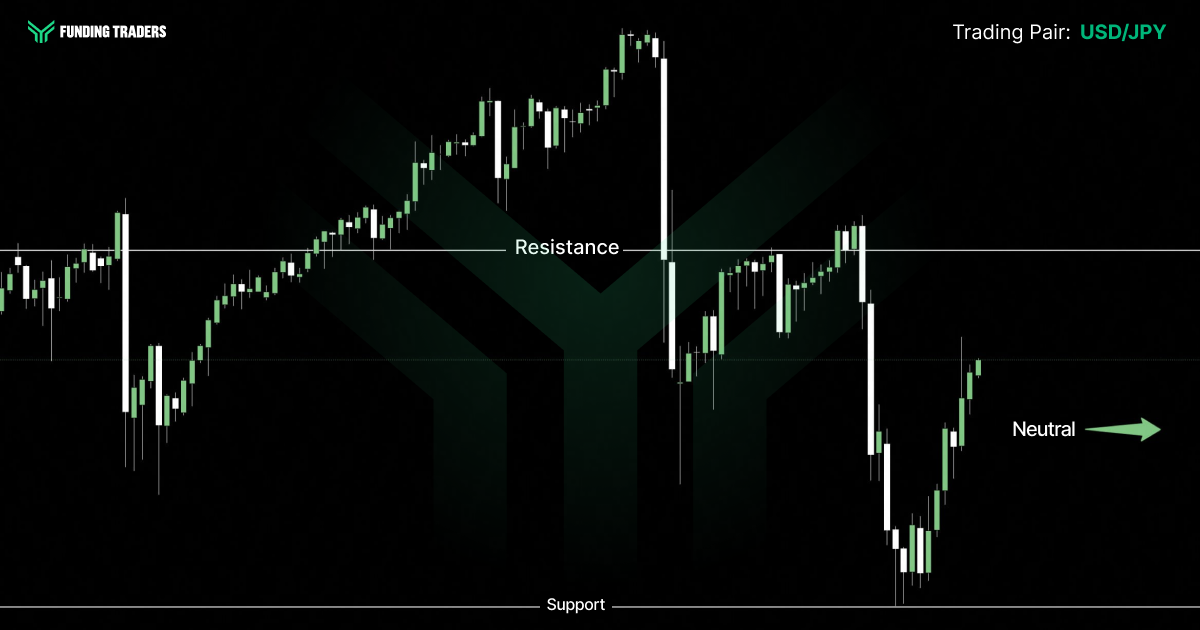
The dollar sat at 157.00 yen on Monday, with traders wary of intervention in thin holiday trade after Friday’s reported rate checks lifted the yen. Tokyo is shut until Thursday, so market depth is poor during holiday trading hours and spreads can widen fast. History warns the bulls: in Golden Week, Japan spent roughly ¥11.7 trillion after the pair broke 160.
Technical analysis from ActionForex marks 158.04 as a temporary top. Above it, the path opens to 159.72, while a break of 155.32 targets 152.87. Bias: range-bound with a lid. Buying near 158 means betting against a ministry with a proven ability to move this pair more than a yen in a session, so it makes sense to wait for Thursday’s reopen.
USDCHF and AUDUSD
The franc is losing its safe-haven shine. USD/CHF traded near 0.8220 on Friday after briefly clearing 0.8250, its highest since May 2025, as investors use the franc to fund carry trades. The break of the 0.8205/13 zone points toward 0.8393, with 0.8332 the next hurdle and 0.7948 the level that would undo the bullish view. Thursday’s SNB is expected to hold at 0% even after August inflation rose to 0.8%, and every hike elsewhere chips away at the franc’s value. Bias: bullish.
The Aussie tells the opposite story. AUD/USD held near 0.7120 on Friday after hawkish RBA comments, with markets pricing a 96% chance of a hike on 29 September. Support sits at 0.7090-0.7080, and resistance at 0.7118 and 0.7130. Thursday’s jobs report is expected to show a 20,000 gain, and the market potential favors the Aussie if that lands and oil calms. Bias: mildly bullish.
WTI Crude Oil
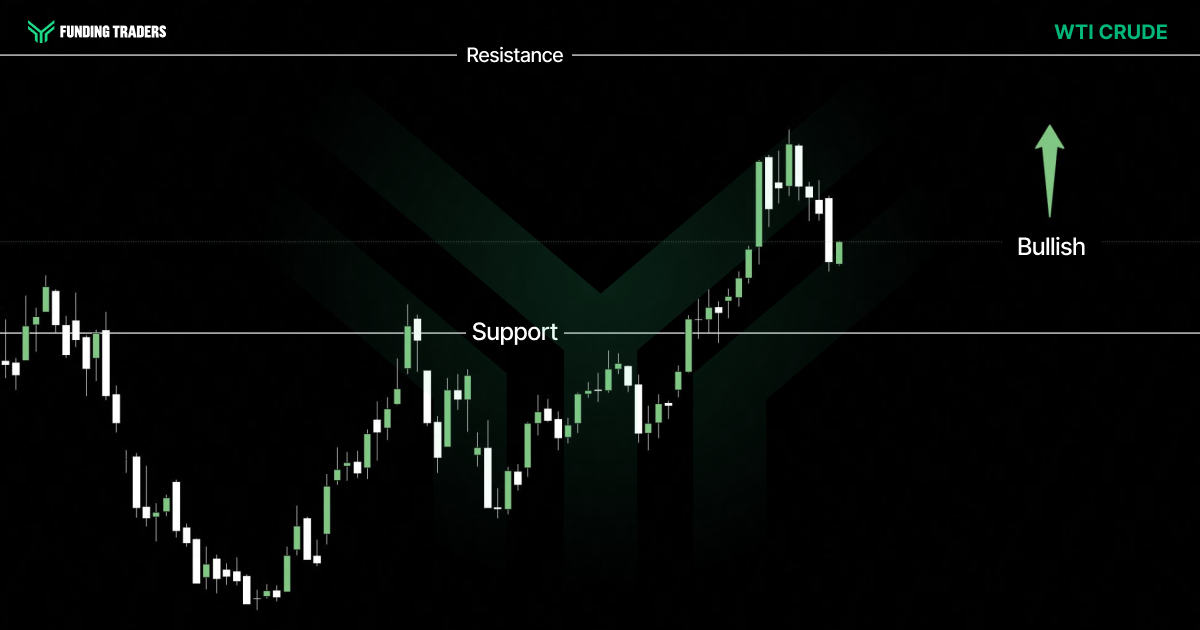
Oil is the hinge of the week. On Monday, October WTI fell 1.83% to $98.46 and Brent dropped 1.66% to $102.15. That extends the pullback from a $105.83 close on 15 September.
The bearish case is supply finding workarounds. Reports say Riyadh aims to restart some pipeline flows quickly, and Saudi ship-to-ship transfers keep its market share alive in Asia. JPMorgan’s commodities team says Middle East flows are holding up better than feared.
The bullish case is everything else. Three pumping stations were damaged, the repair process has no firm timeline, and Aramco told at least two European customers they will get no crude next month. Chinese refiners are scrambling against competitors for replacement barrels, and that competition keeps a floor under prices. Analysts at CBA now see 5 to 10 weeks before global inventories run down, and Goldman flags rising odds of Brent above $120. For the industry and the wider global market, this is a supply shock with a deadline.
Resistance sits at $103.23, then about $113.11; support sits at $95.48, then $90.04. One warning on contract rollover: October is in its final sessions and November trades over $2 lower. If you trade commodity CFDs, check which month your platform quotes. Bias: bullish, with two-way headlines.
Key Economic Events: September 21 – September 25, 2026 (GMT+3)
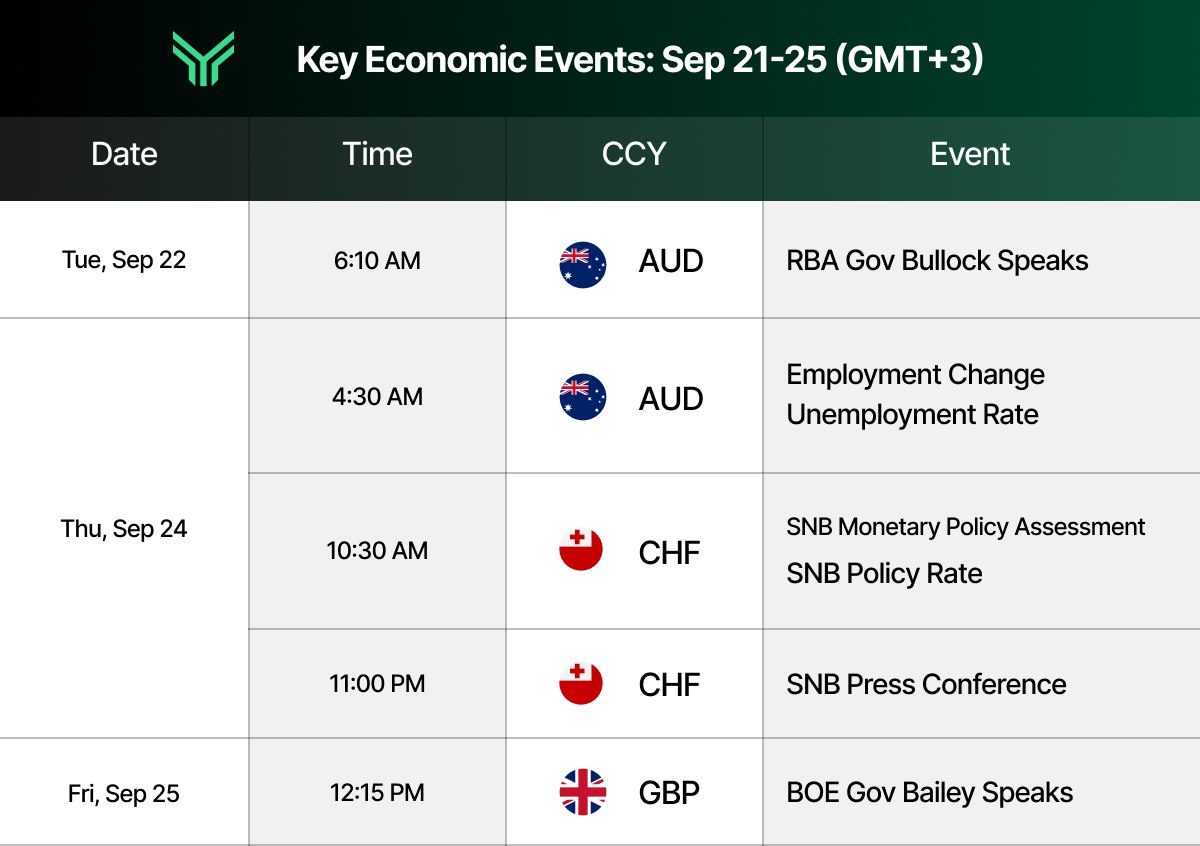
This condensed calendar is adapted from the Forex Factory economic calendar at forexfactory.com, a leading resource professional traders use to track market‑moving macro news and central bank events in real time.

Asset Watchlist: Market Intelligence Snapshot
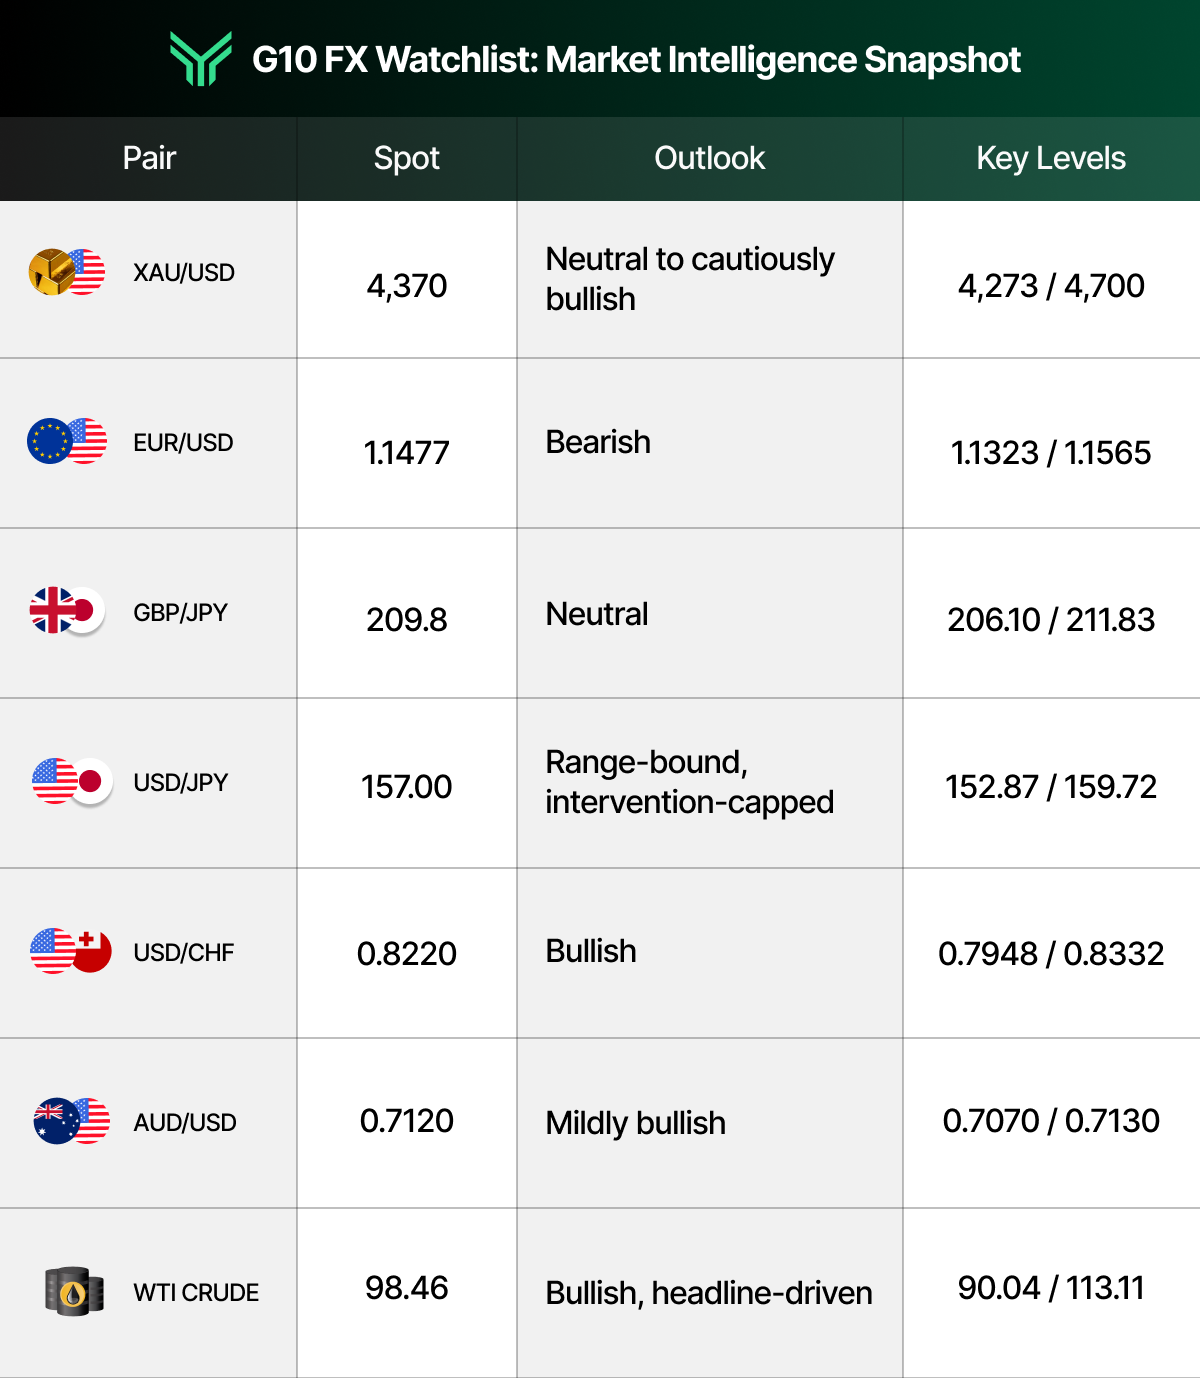
All levels are drawn from current technical research and are reference points, not guarantees.
Actionable Insights for the Week to Drive Growth
Preparation is the edge in a week like this, and it separates professional traders from tourists. Our methodology is simple, a comprehensive methodology for event weeks: a Phase One base case built on current pricing, then Phase Two triggers that tell you when to flip or press. Explore both, then pick the setups that fit your style.
Phase One is the base case heading into Tuesday’s Gulf meeting. On USD/CHF, buy dips near 0.8205/13 with a target of 0.8332, and exit on a daily close back below 0.8205. EUR/USD is a sell-the-rally story, with moves into 1.1500-1.1565 offering entries toward 1.1453 and then 1.1323. Gold is a range trade: buy near the 100-day ($4,320.72) only while oil keeps falling, and take profits into the 200-day ($4,541.17). USD/JPY is not worth chasing above 158, where a yen or two of reward sits against real intervention risk. On WTI, trim size, respect $95.48 and $103.23, and avoid full overnight exposure into the meeting.
Phase Two covers the triggers that flip or deepen the thesis. De-escalation would come from a credible Iran framework out of Tuesday’s talks with the Gulf Cooperation Council, the regional organization that includes Saudi Arabia, or from Chinese help with Tehran after Thursday’s summit. The response there would be crude testing $95.48 and possibly $90.04, easing yields and a softer DXY, and gold challenging its 200-day. Escalation would look like a harder US line on Iran, new strikes on Saudi infrastructure, or tariff threats that sour the Xi meeting. That risk is real because the new sanctions law gives Washington 30 days to implement duties of up to 100% on top buyers of Russian energy. The response in that scenario is crude back toward $103.23, the 10-year above 5%, the DXY through 100.46 and the S&P 500 testing 7,500. On the data side, Wednesday’s flash PMIs and Thursday’s Aussie jobs are the key raw data, so track October hike odds on CME FedWatch and gold positioning in the weekly CFTC report.
For prop traders, the risk side of the playbook matters as much as the idea. For example, know your daily drawdown buffer and your maximum drawdown before Tuesday’s headline, not after. Cut position size and set a hard stop-loss on every trade. Check your rules on news trading and on holding positions over the weekend. Slippage grows when liquidity thins, and leverage magnifies every gap. You do not need to hit your profit target on one headline. It is essential to identify your invalidation level and analyze the reaction, not the headline, because that is how strategic decision making turns market opportunities into actionable trades. These Market Insights supply the relevant levels. Execution is yours.
Stay Ahead of the Market
The framework is easy to say and hard to trade: oil drives inflation, inflation drives the Fed, and diplomacy drives oil. Tuesday’s Gulf meeting and Thursday’s summit can reset all three. Understand that chain and you will discover the setups, and the trends, before the crowd does.
That is why our Market Insights series exists: to give you the map before the move. Today’s market trends (sticky yields, a firm dollar, crowded gold) are the future trends likely to shape the quarter, so use these insights to plan, not predict. Put that knowledge to work, invest the time before Tuesday, and run your trading like an enterprise.
The growth opportunities in weeks like this belong to prepared traders. FundingTraders is built for macro traders who act on conviction. High-conviction macro setups deserve a prop firm with clear rules. Know your risk rules before your first trading challenge. Treat a funded account as the reward for discipline. Protect your consistency above all.
Disclaimer: Trading involves significant risk and is not suitable for every investor. Past performance is not indicative of future results. The information provided in this article is for educational and informational purposes only and should not be considered financial, investment, or trading advice. All account rules, payout structures, profit splits, and promotional offers described in this article are subject to change at the discretion of FundingTraders. Promo codes may expire or be modified without prior notice. Always trade responsibly and only risk what you can afford to lose.