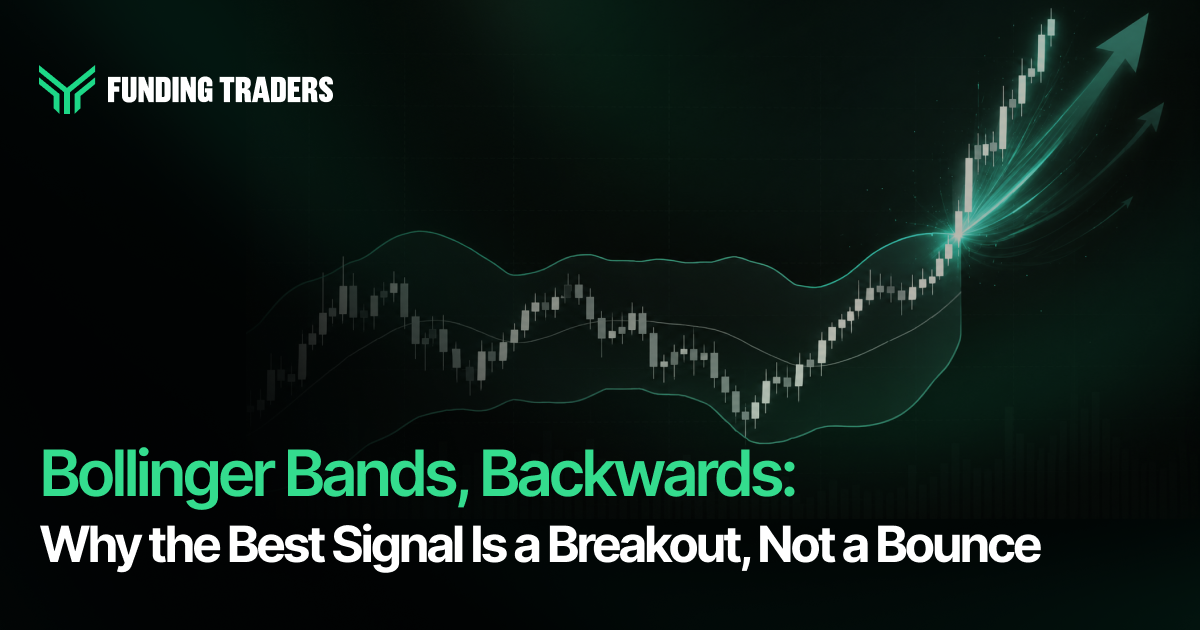
Walk into any trading forum and you’ll find the same Bollinger Bands trading strategy repeated like gospel: price tags the upper band, you sell; price tags the lower band, you buy. It’s the most popular of the technical trading strategies built on the indicator, and in a quiet, range-bound market it does fine. It’s also close to the opposite of what a large futures study found actually pays. When John Bollinger’s bands stretch and price closes clean outside them, that’s rarely exhaustion. More often it’s participation, a trend strong enough to join rather than fade. This piece takes the momentum reading seriously, the one most traders skip, and shows you how the setup really works: the entries, the exits, the settings that beat the defaults, and the market conditions where this trend trading strategy earns its keep and where it quietly bleeds.
The Setup in 30 Seconds
Bollinger Bands are a moving average wrapped in a volatility envelope. The momentum version treats a close outside the band as a signal to go with the move, not against it: buy after a close above the upper band, sell after a close below the lower band, and stay in until price closes back through the middle line. It suits swing traders and position traders working higher timeframes, not scalpers. The strategy lives on strong trends and dies in chop, so the honest risks are whipsaw and long flat stretches between winners. The payoff is the classic trend profile: many small losses paid for by a few large, patient wins. Because those wins need weeks to develop and a stop wide enough to survive noise, it fits a firm whose rules allow overnight and weekend holds and won’t cut you off for sitting in a position. That’s where FundingTraders comes in, and we’ll get to exactly how its drawdown limits shape your sizing.
Most Traders Read Bollinger Bands Exactly Backwards
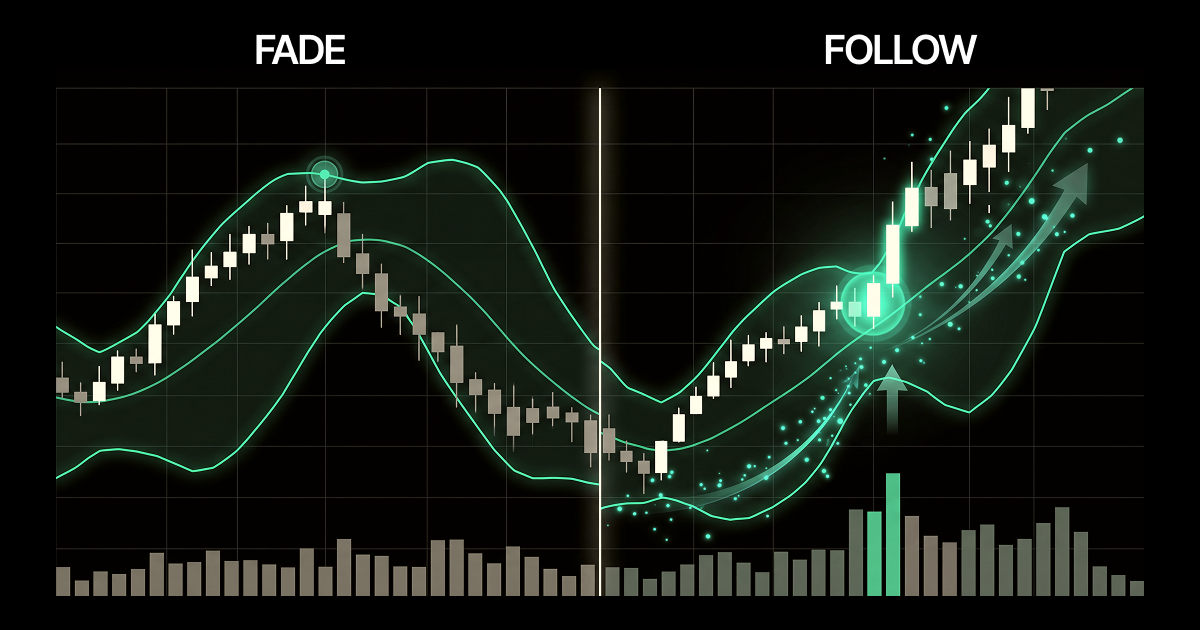
Here’s the misconception the whole strategy hinges on. The default lesson says the bands are a support and resistance tool: the outer bands act as ceilings and floors, so you sell the top and buy the bottom. In a sideways tape, fine. But price closing outside a band is not a rubber wall being hit. Statistically it’s an unusual, high-conviction move, the kind that tends to have more behind it. The momentum model reads that same event as a green light in the direction of the break.
The edge is behavioral and structural at once. A close beyond a properly-set band means volatility just expanded and price pushed through it anyway. That combination, expansion plus follow-through, is what the start of a real trend looks like. Fading it puts you in front of the exact flows that carry markets for weeks. Joining it puts you behind them. The Oxford Capital Strategies research verified this over 42 futures markets and 36 years of data and found the trend interpretation tradeable enough to earn a C grade, which sounds modest until you remember most retail setups never get formally tested at all.
This is not chart patterns or gut feel. It’s a mechanical read of price movements at the band edge, and that mechanical quality is the point. You’re not predicting; you’re reacting to a defined event.
Technical Analysis, Not Fundamentals, Drives The Signal
Be clear about what this is. It’s pure technical analysis, built on price and its own volatility and nothing else. It isn’t one of the fundamental trading strategies that lean on rates or earnings, and it asks for no fundamental analysis at all. If your edge comes from reading a central bank, this isn’t your tool; if it comes from disciplined price action, it is. It’s also not a day trading setup. The exits key off daily closes and winners take weeks, so day traders hunting a small profit before the bell find nothing here. This is a trend traders’ and swing traders’ method that lets a profitable return compound over a long time horizon. One honest aside: holding winners for months carries tax implications that vary by jurisdiction, so keep that in your trading plan.
The Default 20-Period Settings Are The Weakest Ones You Can Pick
This is where the study earns its fee. Almost everyone runs Bollinger Bands at the factory setting, a 20-period average with a 2-standard-deviation band. The research is blunt about it: the default is not optimal. Across the sweep, slower settings, a long term moving average north of 60 periods, performed better than the twitchy 20. Trading less often, on a smoother line, filtered out the marginal signals that bleed a trend system dry.
The second finding matters just as much. The volatility envelope has to actually be there. Set the band width to zero and you’ve got a bare moving-average crossover; performance improved specifically when St_Dev was above zero. The band isn’t decoration. It forces price to travel a real distance beyond the average before you commit, and that distance is what separates a genuine breakout from a wiggle. These are two of the key components most technical indicators users never touch: slow the average down, and keep the envelope wide.
Read that as a warning about specific market conditions, not a magic number. Slower settings suit trending regimes and patient capital. The sweep is a map of the terrain, not a recommendation to grab the single highest peak, and we’ll come back to why chasing that peak is a trap.
Testing whether a 60-period band beats the 20 is exactly the kind of work you want to do before real money is on the line. Run the comparison inside a FundingTraders evaluation, with a clear 5% daily loss limit and 10% total drawdown defining your risk, and prove the settings on funded capital instead of a hunch. Use code GOAL for 50% off all accounts and a 100% profit split during the Final Whistle Deal.
The Key Components Of The Trading Plan: Entries, Exits, And One Very Wide Stop
Strip it to rules a machine could run. The strategy combines a moving average with a standard-deviation band, and the setup is a single condition. For a long, the prior bar must close above the upper band. For a short, the prior bar must close below the lower band. There’s no second confirmation filter in the tested version, which keeps it honest and repeatable.
Entry is mechanical: after a valid setup, you take the trade at the next market open. Not a discretionary “wait for a pullback,” not a limit order hoping for a better fill, just in at the open. That removes the hesitation that turns a good system into a bad one.
Exits are where the character shows. There are two. The trend exit closes the trade when price closes back through the middle moving average, your signal that the move you joined has lost its legs. Underneath that sits a protective stop-loss placed a full 6× ATR(20) from entry. Six times average true range is enormous by retail standards, and that’s deliberate. A trend needs room to breathe through counter-moves that would stop out a tight-fisted trader ten times before the real move arrives. Position size does the rest of the risk management: the study risked 1% of capital per trade, fixed fractional, so the wide stop never turns into an oversized loss. That’s the trade-off, wide stop, small fraction, and it’s the correct one for this style.
Walk one through. Say crude oil compresses, then closes decisively above its upper band. You buy the next open. Your stop sits 6× ATR below, far enough that ordinary noise won’t touch it. If the prevailing trend carries, you do nothing but hold, trailing conceptually behind the moving average, until a close finally drops back under it and you exit. Whether that specific instance pays depends entirely on whether the trend continues, and plenty won’t. The system doesn’t need them to. It needs the ones that do to be big.
Strong Trends Feed It, Chop Starves It
No trading strategy works everywhere, and this one is unusually honest about its home turf. It feeds on strong trends and starves in ranges. When a security grinds sideways, price keeps poking outside the bands and snapping back, and each poke is a fresh signal that goes nowhere. That’s whipsaw, and a strung-together run of it is how this system draws down. The Oxford study didn’t hide it; the equity curve took a real drawdown before recovering. A C rating is not a magic bullet, it’s a competent, tradeable edge with rough patches you have to sit through.
Expect a low win rate. Trend systems typically lose more trades than they win, then more than make it back on the few that run. If you need to be right often, the psychology will break you long before the math does. And don’t lean on support and resistance to bail you out here. In a genuine trend, the resistance levels everyone’s watching get sliced straight through, which is precisely the move you’re trying to be on the right side of. Match the strategy to your own risk tolerance before you size a single trade, because steady sizing through the flat stretches is a demand on temperament as much as method.
Running The Bands On Funded Capital
Here’s the practical question a serious trader asks: can you even run this at a prop firm? The rules of the firm decide it, because a strategy that holds winners for weeks and rides a 6× ATR stop runs headfirst into the restrictions most evaluations bury in the fine print. This is where FundingTraders stops being a logo and starts being the reason the setup is viable.
Start with holding. Trend trades are held overnight as a matter of course, and often across weekends, so any firm that forces a flat close would gut the strategy. FundingTraders permits overnight and weekend holds outright, and puts no time limit on active days, which is exactly what a patient, selective system needs. Then instruments. The study used futures, but the same mechanical logic maps cleanly onto cfd trading and forex, and FundingTraders spans forex, indices, metals, commodities, and crypto. Whether you’re trading cfds on an index or running the bands on a metal, the financial instrument is covered.
Because the logic is fully mechanical, this is a natural candidate for automated trading. FundingTraders allows EAs within its risk limits and permits copy trading between a trader’s own setups, so you can encode the four rules and let them run on FundingTrader’s supported platforms rather than watching daily closes by hand. That suits a system this rule-based far better than discretionary trading does.
Now the numbers that govern your sizing. The evaluation runs as a 1-step or 2-step challenge with a 10% profit target, 10% total drawdown, and a 5% daily loss limit. A wide-stop trend system has to respect that ceiling: a 6× ATR stop only works if your fixed fraction keeps a single stop-out well inside the daily limit, the same 1% logic the study used. Clear consistently and the scaling plan raises your capital 25% every three months, on accounts from $5K to $400K, with a profit split up to 100%, zero commissions on evaluations, and weekly payouts through Rise and Coinbase. For a newer trader there’s a genuine on-ramp: the novice path makes Phase 1 completely free, so you pay only after you pass, which is about as close to a risk free environment as live-rule trading gets. It’s worth knowing the firm’s revenue model mirrors successful funded traders rather than profiting from failed evaluations, a quiet but real alignment of interest.
If your edge needs room to hold a trend through a weekend and a stop wide enough to survive the noise, you need rules that allow it. FundingTraders permits overnight and weekend holds, EAs within risk limits, and pays out weekly, so a slow-band trend system can actually run. Start your challenge with code GOAL for 50% off and a full 100% profit split, Final Whistle Deal only.
Where Traders Blow Up A Perfectly Good Edge
Most failures here are self-inflicted. The first is the original sin: fading the bands out of habit even after committing to the momentum model. Under pressure, many traders revert to selling the top and buying the bottom, taking the losing side of the very trends they meant to catch.
The second is over-optimization. Stare at a sensitivity map long enough and you’ll want the single best-looking pair of average and band width. Don’t. That peak is fitted to the past, and the future rarely lands on the same coordinate. Pick a robust region, slow average and real envelope, and leave it. Chasing the perfect best trading strategy setting is how a durable edge gets curve-fit into a fragile one; the point of a fixed plan is that it survives conditions the backtest never saw.
Third, don’t touch the stop. That 6× ATR distance looks reckless, so people tighten it, and tightening it turns a trend system into a machine for booking small losses right before the move. The wide stop is load-bearing. Fourth, don’t quit in the drawdown, because the strategy makes its money in a few bursts and leaving during the flat stretch strands you before the run that pays for everything. Fifth, don’t read a backtest as a promise; these are simulated results, an edge and not a guarantee.
If there’s a through-line to good trading decisions here, it’s restraint. The best trading outcomes come from doing less: fewer tweaks, wider stops, longer holds. Pair the bands with other indicators only if it genuinely helps, something like on balance volume to check whether a breakout has real participation, but resist bolting on five popular indicators and calling it confirmation. Most of what these trading strategies are based on is discipline, not complexity.
Slower Bands, Longer Horizons
Strip away the noise and the momentum reading of Bollinger Bands is a simple, honest trading strategy: slow the average down, keep the envelope wide, join the break instead of fading it, and let a small handful of trends do the heavy lifting while a wide stop keeps the losers small. It won’t feel exciting. Trend following rarely does. But it’s a coherent edge that held up across four decades of data, and that’s more than most methods can claim.
What separates the traders who make it work is temperament, not cleverness. They practice the setup until the entry is automatic, they respect risk and drawdown instead of fighting them, and they know their account’s rules cold before they add size. That’s why the firm you run it on isn’t a detail. Deploying this on FundingTraders, where overnight holds are allowed, EAs are permitted, and payouts land weekly, is the difference between a strategy that works on paper and one that works on funded capital. Learn the rules, size to survive the flat stretches, and only then let the scaling plan compound your revenue growth account by account.
Get the core right and the next refinement, a smarter trailing exit, a volatility filter, a cleaner instrument mix, is just a layer on a foundation that already holds. Master the boring version first. The market pays patience far more reliably than it pays flash, and the traders who internalize that are the ones still standing when the trend finally shows up.
You’ve got the rules. Now go build the discipline where it counts, on capital that lets a trend actually run. FundingTraders gives you overnight and weekend holds, and up to a 100% profit split. Claim the Final Whistle Deal with code GOAL for 50% off all accounts, and put the slow-band edge to work.
Disclaimer: Trading involves significant risk and is not suitable for every investor. Past performance is not indicative of future results. The information provided in this article is for educational and informational purposes only and should not be considered financial, investment, or trading advice. All account rules, payout structures, profit splits, and promotional offers described in this article are subject to change at the discretion of FundingTraders. Promo codes may expire or be modified without prior notice. Always trade responsibly and only risk what you can afford to lose.