Every trading strategy promises an edge, but most traders still fail. Not because the strategy is broken, but because they never commit to one approach long enough to let it work. The trend following trading strategy is one of the best trading strategy options for retail and funded traders because it removes the need to predict price movements and instead reacts to where price is already moving. At FundingTraders, our community of funded traders has proven that simple strategies executed with discipline inside a structured trading plan consistently outperform complex methods in the financial markets. This article breaks down how trend following works, why it remains one of the most reliable technical trading strategies in 2026, and how you can apply it inside a prop firm challenge to trade your way to a funded account. Whether you come from day trading, swing trading, or you are testing fundamental trading strategies alongside technical analysis, this guide gives you the framework to build consistent results.
Quick Summary Box
This guide walks you through the trend following trading strategy from the ground up. You will learn the market psychology behind it, how to spot valid setups versus traps, concrete entry and exit rules, and how to apply this strategy inside a funded trader program. We cover how to manage risk tolerance within prop firm rules, how to size trading positions for challenge accounts, and how to use technical analysis alongside price action to ride trends for maximum profit.
If you have been jumping from strategy to strategy looking for the best trading strategy, this article will show you why trend following might be the one strategy you stick with. The key components are simple: identify the trend, wait for a pullback, enter with the prevailing trend, and manage risk with a fixed plan. Trading strategies are based on probabilities, and trend following stacks those probabilities in your favor when you trade with discipline.
Ready to put this strategy to work inside a real trading challenge? FundingTraders is offering an unbeatable deal right now, use code MADNESS for 30% OFF every challenge plus a 100% profit split. You keep it ALL. No limits, no cap. Start your challenge and join over $5.5M in total rewards paid out to traders just like you.
What Trend Following Actually Is, And the Market Psychology That Makes It Work
Most trading strategies are based on predicting reversals. Trend following takes the opposite approach. This strategy waits for the market to confirm a direction and then rides that momentum until the evidence says the trend is over.
The logic is rooted in crowd psychology and market dynamics. When institutional investors and large fund managers commit capital in one direction, that creates momentum. Retail traders, algorithms, and late arriving investors pile in, extending the move. Buyers attract more buyers in an uptrend, and selling pressure attracts more selling in a downtrend.
This is why trend following has survived every market cycle since the 1970s. It does not depend on a specific financial instrument, a specific person’s analysis, or specific market conditions. Whether you are trading stocks, forex, commodities, or trading CFDs, the principle is the same: price moves in trends, and those trends last longer than most traders expect. The strategy combines simplicity with adaptability across every asset class and every time horizon.
Because you are not fighting the market or calling tops and bottoms, trend following reduces the emotional strain that destroys most traders during a challenge. You are responding to what the market is telling you. That alignment between strategy and price reality is what makes this approach repeatable for traders at every level.
The Key Components of a Trend Following Trading Strategy
Every version of this approach, whether used by hedge fund investors or independent day traders, rests on the same pillars.
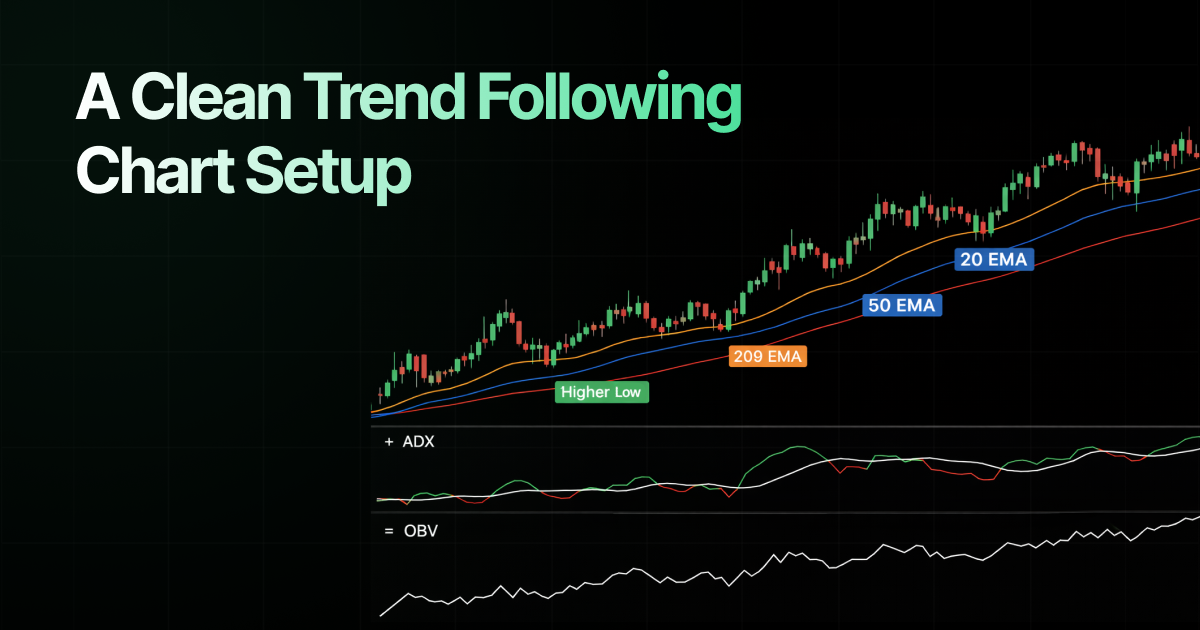
Trend Identification. The first task is figuring out whether an asset is trending or stuck in a range. This is where technical indicators come in. The most common tools include moving averages (the 50 period and 200 period are standard), the Average Directional Index (ADX), and visual analysis of higher timeframes. A long term moving average crossover, such as the 50 crossing above the 200, provides a classic confirmation signal that institutional investors use to validate direction.
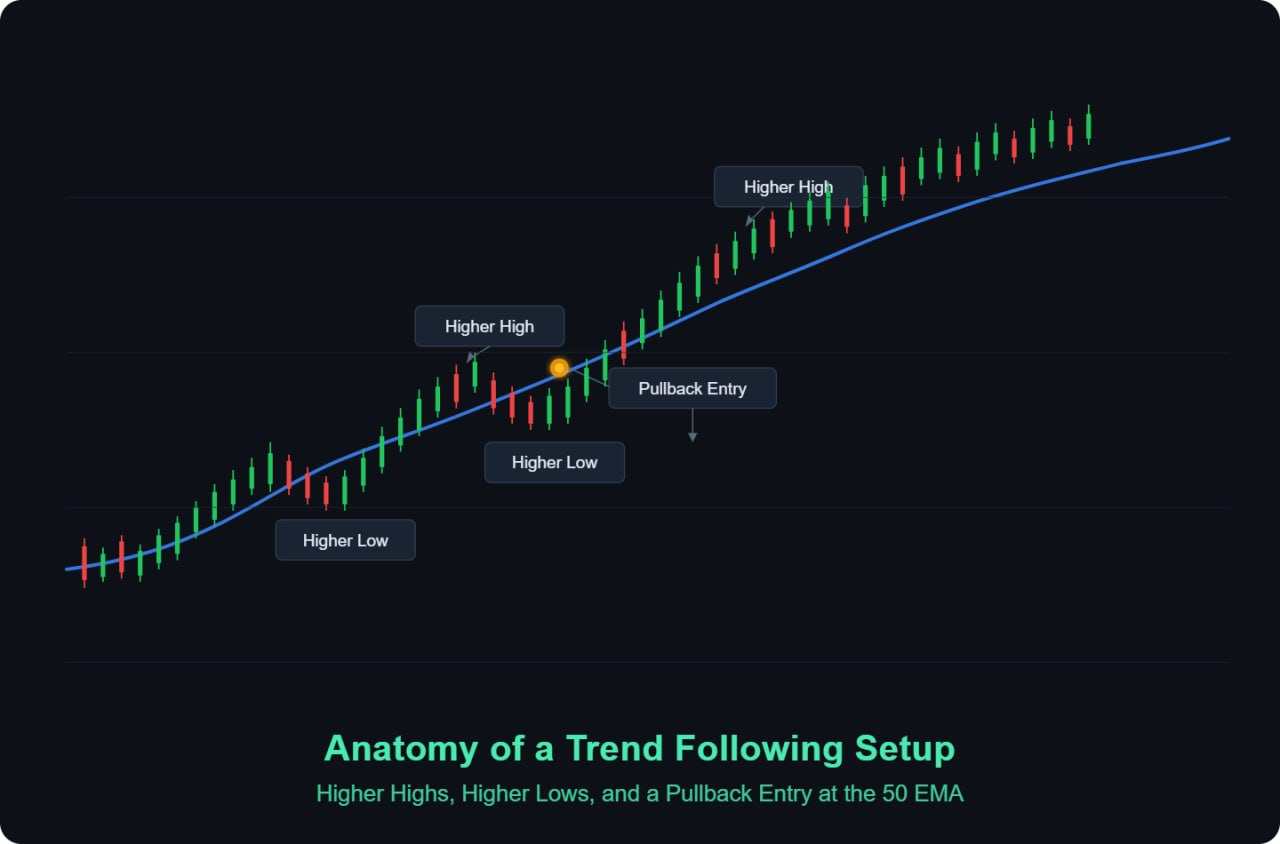
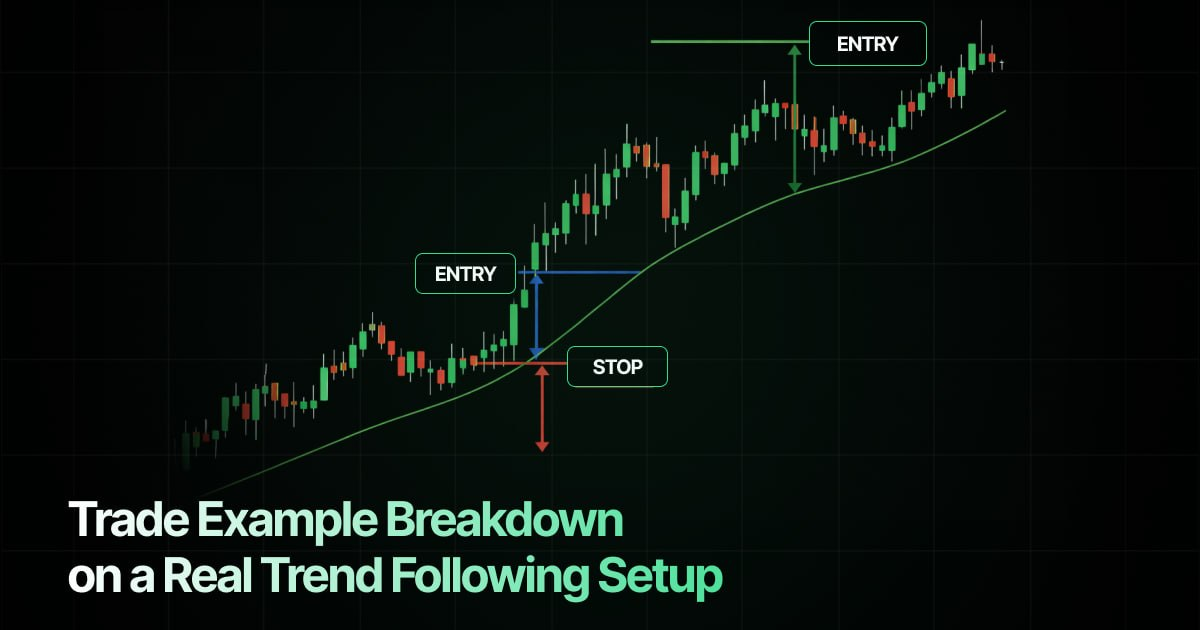
Pullback Entry. Trend traders do not chase price. They wait for a pullback, a temporary move against the trend, and enter when the trend resumes. You are looking for the pullback to stall at a logical level such as a moving average, a prior support and resistance zone, or a Fibonacci retracement.
Stop Loss Placement. Stops typically sit below the most recent swing low in an uptrend or above the most recent swing high in a downtrend. The stop defines your risk on each trade and directly determines your position sizing.
Profit Target or Trailing Exit. Rather than setting a fixed take profit, many trend traders use trailing stops, moving the stop loss in the direction of the trend as price advances. This allows winners to run. Some traders use a fixed reward to risk ratio (2:1 or 3:1), while others let the market tell them when the trend is done.
Position Sizing. Your risk tolerance and the rules of your trading challenge dictate how much capital you allocate to each trade. Position sizing is the bridge between strategy and survival.
Technical Analysis Tools Every Trend Trader Needs
Technical analysis is the backbone of trend following. Unlike fundamental trading strategies, which evaluate revenue growth, earnings, and macroeconomic data, trend following relies on price data and technical indicators to generate trade signals.
Moving Averages. The 20, 50, and 200 EMAs are the foundation. When price is above all three, the trend is strongly bullish. A long term moving average crossover signals major trend shifts that stocks, forex, and commodity traders all watch closely.
ADX. This technical indicator measures the strength of a trend. An ADX reading above 25 confirms a trending market. Below 20 suggests a range. This filter prevents you from taking trend trades in sideways markets.
On Balance Volume (OBV). On balance volume tracks volume flow in and out of a security, confirming whether the trend has real participation behind it. Volume confirmation is one of the most underrated filters among other indicators that trend followers should monitor.
Some traders add MACD or RSI, but these are popular indicators that can create noise if overused. The best trading approach keeps the chart clean.
For traders who use fundamental analysis alongside technical trading, earnings reports and macroeconomic releases can act as catalysts that start or speed up trends. Advanced computer modeling techniques used by institutional firms blend quantitative trend signals with fundamental data, but for most retail traders, clean technical analysis is enough. These are the core tools within most technical trading strategies.
Price Action and Support and Resistance: Reading the Trend Without Clutter
Price action is the raw language of the market. Traders who learn to read price action gain an edge that no indicator can replace.
In a healthy uptrend, bullish candles are larger than bearish candles, pullbacks are shallow, and each impulse leg makes a higher high. When you see longer upper wicks, shrinking candle bodies, or deep pullbacks that test prior support and resistance levels hard, the trend is losing steam. These signals tell you to tighten your stop or reduce your trading positions before the reversal hits.
The ideal pullback retraces to a confluence zone where multiple technical factors line up. For example, the 50 EMA, a prior resistance level that has flipped to support, and the 50% Fibonacci retracement all meeting at the same price. When price reaches this zone and prints a bullish reversal candle, that is your entry signal.
Support and resistance levels are the roadmap of every trend. Old resistance levels become new support after price breaks through. These “flip zones” are where institutional investors often add to their trading positions, fueling the next leg up. Resistance levels above current price tell you where sellers may step in.
Chart patterns like flags, pennants, and ascending triangles are continuation patterns that often appear within strong trends, giving you added confirmation.
Entry Rules, Stop Loss Logic, and the Trading Ratios That Keep You in the Game
Many traders have the right direction but lose money because their entries are sloppy and their trading ratios do not account for prop firm rules.
Entry Rules: Identify the trend on a higher timeframe. Wait for a pullback on your execution timeframe to a confluence level. Wait for a confirmation candle. Place a limit order or enter at market once confirmation prints.
Stop Loss Logic: Place your stop below the pullback swing low (for longs) or above the swing high (for shorts). The stop must be where your trend thesis is truly wrong. Stops too tight get hit by normal volatility. Stops too wide destroy your trading ratios and risk tolerance budget.
Profit Targets: A fixed 2:1 or 3:1 reward to risk ratio provides a predictable framework. Trail your stop to breakeven as the trade moves, locking in a small profit even if the trend reverses early while giving room for a more profitable return if it continues.
A trend following strategy does not need a high win rate. Many successful trend traders win only 40 to 45% of their trades, but winners are two to three times larger than losers. That asymmetry is the edge. Track your trading ratios after every session and let the data guide your trading decisions.
Why Most Traders Blow the Challenge on Risk Tolerance, Not Bad Entries
This is where most funded account attempts die. The strategy is sound, the entries are clean, but the trader ignores risk tolerance, oversizes a position, and hits the daily drawdown limit on a single trade.
Risk management inside a prop firm challenge has hard limits: maximum daily loss, maximum total drawdown, and profit targets with deadlines. Your risk tolerance must match these rules.
Risk Per Trade. Never risk more than 1% per trade. With a 1% risk, you can absorb four straight losses without breaching a 4 to 5% daily limit. Risk tolerance is about surviving long enough for your edge to play out.
Correlation Risk. Two long trades on EURUSD and GBPUSD at the same time doubles your USD exposure. Manage correlation as part of your overall risk.
Emotional Risk. After consecutive losses, the temptation to increase size is overwhelming. This is where a fixed plan saves you. Write your rules in advance. Define your maximum trades per day and your stop for the day threshold. A fixed plan removes decision making when emotions are highest.
Risk tolerance varies by specific person, but inside a challenge, your tolerance is defined by the rules. Align your strategy to the rules, not the other way around.
If you are serious about trading with discipline inside a real challenge, FundingTraders gives you the structure to do it right. Use code MADNESS for 30% OFF every challenge plus a 100% profit split, you keep everything you earn. Over $5.5M in rewards paid out and counting. Start at FundingTraders.
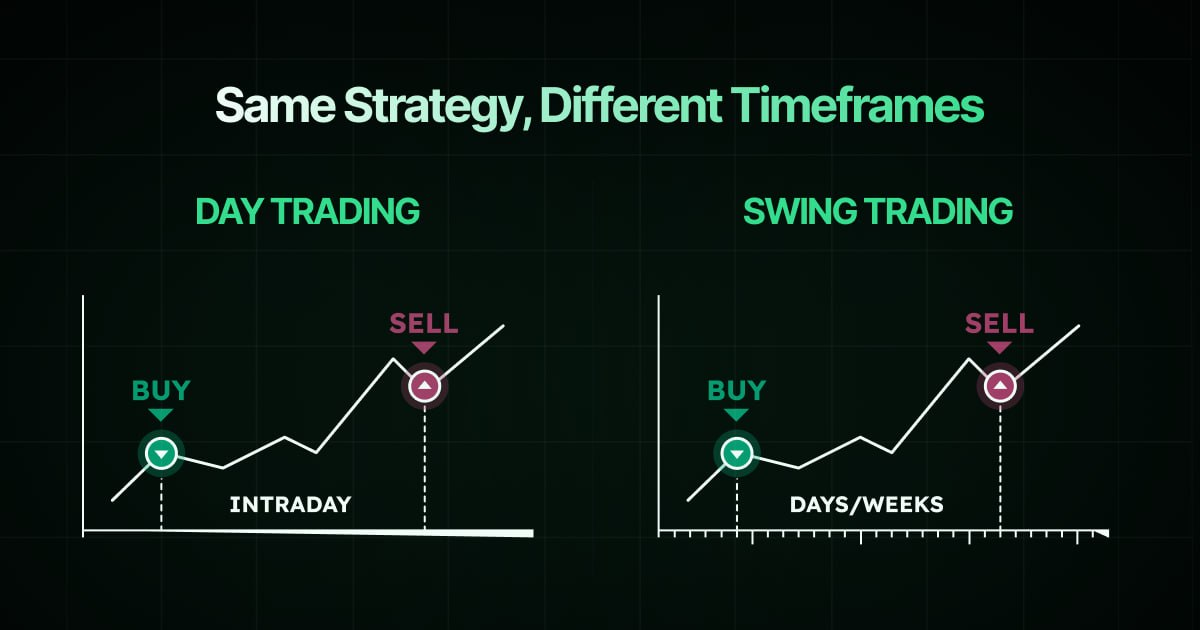
Day Trading vs. Swing Trading: Matching Your Trading Style to Trend Following
Your trading style determines how you apply the strategy.
Day Trading. Day traders execute entirely within a single session, closing all positions before market close. No trade is held overnight. Day trading within trend following is ideal for traders who want tight risk control. Day traders may take three to five trades per day, each targeting a small profit that compounds over the week. The best trading opportunities appear during the London and New York sessions for forex, or the first two hours after market open for stocks.
Swing Trading. Swing traders hold positions for days or weeks on daily and weekly charts. Positions are held overnight. Swing traders accept wider stops in exchange for fewer trades and bigger returns. This trading style suits traders who cannot watch charts all day.
Both work for challenges. Day trading removes gap risk since nothing is held overnight. Swing trading captures larger moves but adds overnight uncertainty. Many traders find a hybrid approach works well. Your trading style should match your personality, your schedule, and your risk tolerance.
From Demo Account to Funded Trader: The Progression That Actually Works
A demo account provides a risk free environment to test your system and build confidence. But many traders skip straight from demo to a funded challenge without a middle step.
Phase 1: Demo Account Mastery. Trade on a demo account for four to six weeks. Track every trade. Your goal is process, not profit. Can you follow your rules? A demo account with virtual funds lets you make mistakes without cost. Use this risk free environment to build the habit of executing your strategy the same way every time.
Phase 2: Small Live Account. Before a full challenge, trade the lowest tier available. The emotional gap between trading virtual funds and real money is huge. This phase exposes weaknesses at minimal cost.
Phase 3: Full Challenge. Once you show consistency over 30 or more trades with positive expectancy, you are ready. Your strategy is validated, your risk tolerance rules are built in, and the challenge becomes a process, not a gamble.
Enable traders to succeed by respecting the learning curve, and the funded account becomes a natural outcome.
FundingTraders has challenge accounts for every level, and right now, code MADNESS gets you 30% OFF plus a 100% profit split. Whether you are stepping up from demo or ready for a full evaluation, this is the time to start. Join the community and trade toward your first payout.
Backtesting, Journaling, and the Metrics That Predict Funded Account Success
You cannot improve what you do not measure. The gap between traders who ensure consistent results and those who blow accounts is almost always data.
Backtesting. Test your strategy across at least 100 historical setups using TradingView’s replay feature. Record entry, stop, target, and outcome. This gives you baseline numbers: win rate, average winner, average loser, and maximum drawdown.
Journaling. Every trade gets logged. Record the setup, entry reason, exit reason, emotional state, and a chart screenshot. Over time, patterns show up that turn gut feel into hard data.
Key Metrics: Win rate (trend following typically produces 40 to 55%). Profit factor (above 1.5 is solid, above 2.0 is excellent). Maximum drawdown must stay within your challenge’s limits. Track weekly. If expectancy is negative, go back to backtesting. Consistent results come from consistent process, and the journal is where you ensure consistent results over time.
Practical Examples: Wins, Losses, and What the Market Looks Like
Example 1: EURUSD Swing Trade Win. In February 2026, EURUSD showed a clear downtrend. Price pulled back to the 50 EMA and a resistance level at 1.0420. A bearish engulfing candle confirmed the entry. Short at 1.0415, stop at 1.0460 (45 pips), target at 1.0280 (135 pips, 3:1). Price sold off over four days, hitting the target. The trade was held overnight for three sessions, delivering a profitable return.
Example 2: Nasdaq 100 CFD Day Trade Win. During a bullish trend, price pulled back to the 20 EMA on the 15 minute chart after market open. A bullish hammer formed. Long at 21,450, stop at 21,410, target at 21,530 (2:1). Hit within three hours. No position held overnight. Trading CFDs on indices is one of the most popular approaches for day traders who want equity exposure without holding individual stocks.
Example 3: Gold Swing Trade Loss. Gold appeared to be in a strong uptrend. A pullback entry at $2,185 with a stop at $2,168 looked clean. A surprise U.S. inflation report gapped price below the stop. Exited at $2,162 for a larger than planned loss. Even with valid setups in strong trends, outside events can override the technical picture. One strategy like this absorbs the loss because position sizing was correct. The loss was 1.2% of the account. Painful but survivable.
Conclusion
The trend following trading strategy has survived every market cycle since the 1970s because it works. It does not require you to outguess the market. It requires patience, discipline, and a willingness to let the trend do the heavy lifting. The best trading strategy is the one you can execute consistently, and trend following provides the clarity to do exactly that.
At FundingTraders, we have built a platform and community designed to enable traders to move from preparation to execution. Over $5.5M in total rewards paid out proves this is a proven path for investors and traders ready to commit. The market rewards preparation. Your funded account is waiting.
Disclaimer: Trading involves significant risk and is not suitable for every investor. Past performance is not indicative of future results. The information provided in this article is for educational and informational purposes only and should not be considered financial, investment, or trading advice. All account rules, payout structures, profit splits, and promotional offers described in this article are subject to change at the discretion of FundingTraders. Promo codes may expire or be modified without prior notice. Always trade responsibly and only risk what you can afford to lose.