
This week’s Market Insights finds the global market caught between record-setting celebration and quiet doubt. Stocks sit at all-time highs, yet the raw data underneath tells a harder story: jobs are shrinking, customers are pulling back, and inflation risk still hangs over the world because a naval blockade keeps oil supply tight. The Federal Reserve publishes the minutes of its July meeting midweek, and no organization moves markets quite like it, those words may decide whether traders keep their confidence or lose it. Below, our analysis breaks down every major asset, the events that matter, and the trends, forecasts and latest insights shaping the days ahead.
Quick Summary Box
The week’s tone is stretched optimism resting on a fragile base. Gold trades just under a two-month ceiling with a bullish tilt, and the future path of Fed rate expectations after Wednesday’s minutes is its main driver. WTI crude carries a firm bid and a wide potential range while the blockade at the Strait of Hormuz throttles supply, so any headline about a diplomatic solution can swing the energy complex hard in either direction. The S&P 500 keeps printing records on technology strength and broad momentum, but retail earnings will test whether key industries tied to the consumer can keep the run alive. The dollar index sits on the floor of its yearly uptrend with a soft, undecided bias, and a decisive break lower would ripple through every pair we track. The euro is firm, the yen trades in the shadow of intervention, the franc remains the haven of choice, and the Aussie leans on a hawkish central bank near multi-week highs.
Asset Breakdown: Market Research on Global Markets
Gold (XAUUSD)
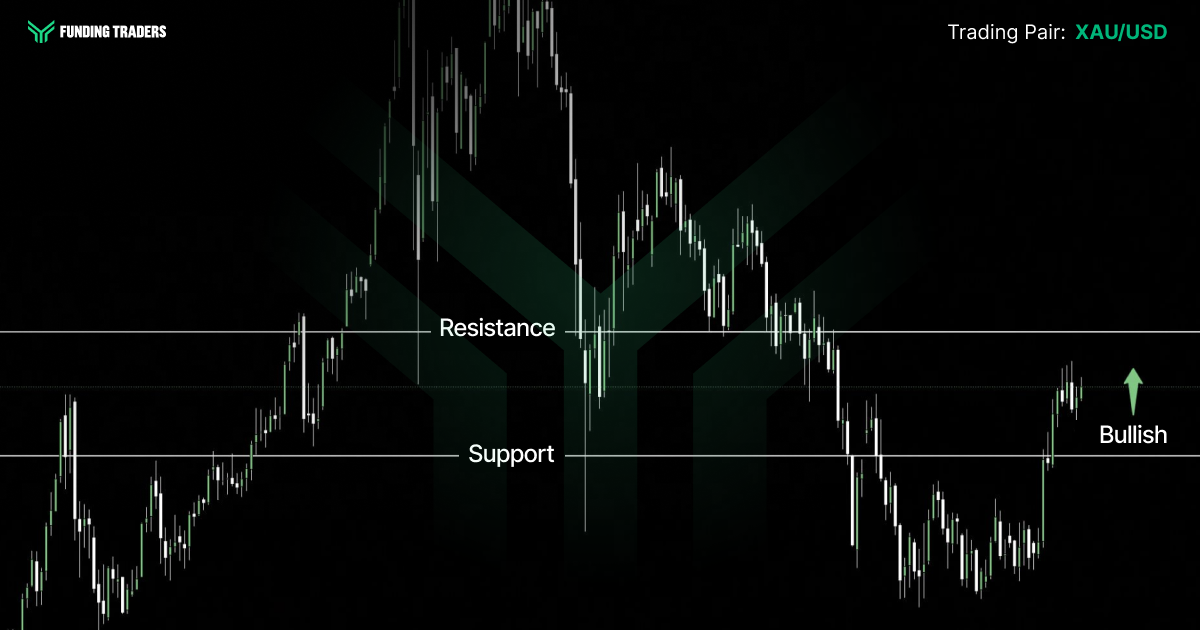
Gold enters the week near $4,392 after tagging a fresh two-month peak close to $4,450 on fading bets for a September Fed hike; price is consolidating around the 100-day average at $4,386, and bulls need a decisive close above $4,400 to reopen the highs. Below, support stacks at $4,313, then $4,255 and $4,202; above, resistance sits at $4,441 and $4,510. The record high near $5,595 from late January leaves plenty of air overhead if momentum returns.
The institutional read mixes respect with caution. Goldman Sachs’ commodities team trimmed its end-of-2026 target to $4,900 after pushing its Fed rate-cut forecasts into next year, and warned an actual hike could drag gold back toward $4,400, long-term bullish, near-term careful, in the analysts’ own framing. Hedge funds and fast money will key off Wednesday’s minutes: hawkish language is the metal’s main near-term risk, while any blockade escalation is instant fuel for safe-haven demand. Identify your levels before the release, not after.
Levels are only half the trade, the other half is capital that can hold them. Take a FundingTraders evaluation and trade gold’s next break with a 100% profit split on the table: use code EXTRAVAGANZA and get three accounts for the price of one. Start your evaluation
EURUSD
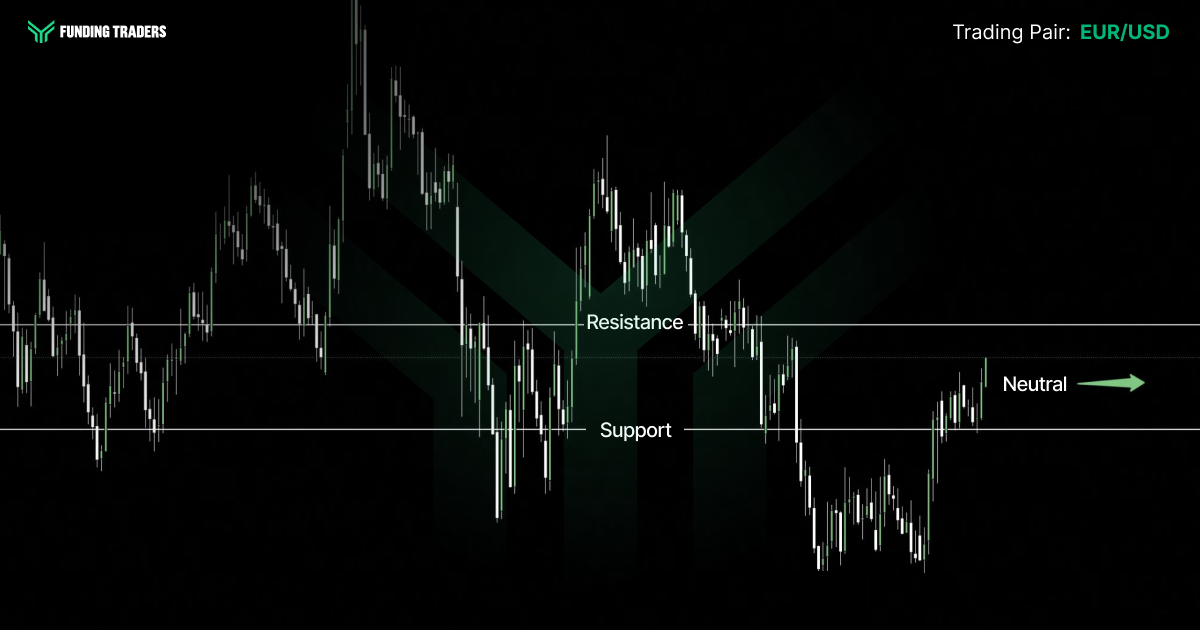
The euro holds near its August peak at 1.1581, trading a narrow band as dollar demand stays subdued after weak US employment figures; resistance waits at 1.1635, with support at 1.1535–1.1516 and a deeper pivot at 1.1438. The story beneath has improved: second-quarter growth in the euro area was confirmed at 0.4% for a 1.0% annual pace, and the trade balance swung back to surplus in June, points highlighted by Scotiabank strategists. The tests come Tuesday (German ZEW), Wednesday (final euro-area CPI) and Friday, when flash PMIs and negotiated wage data feed straight into ECB thinking. Bias: constructive while the mid-1.15s hold; below 1.1438, stand down.
USDJPY
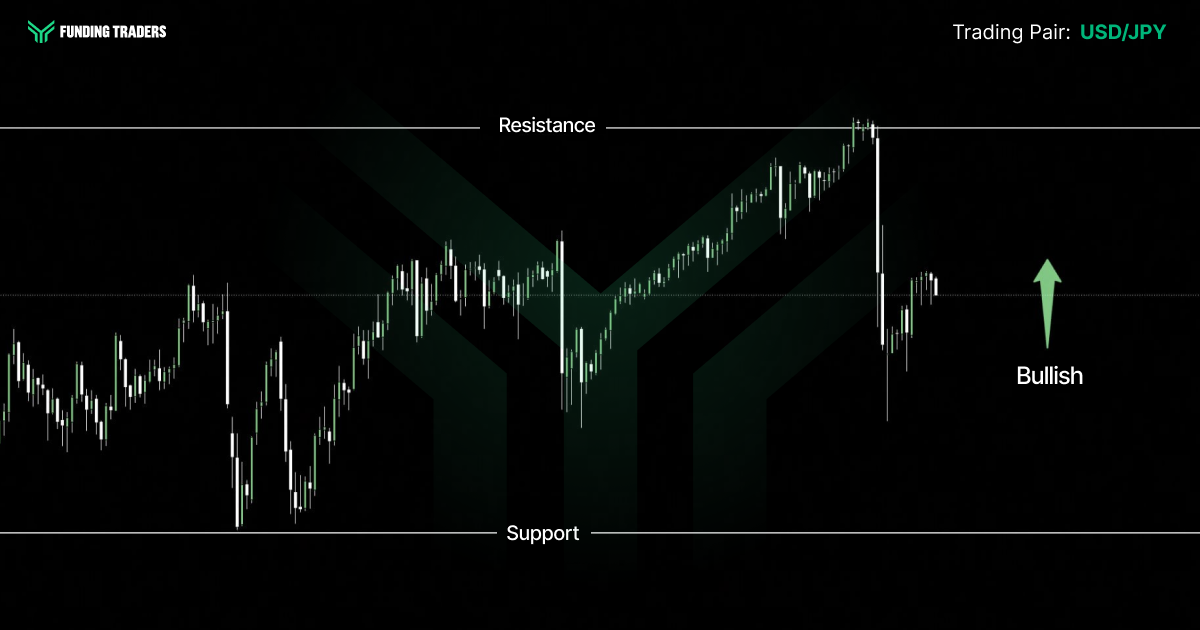
Dollar-yen hovers at 159.0–159.3, pinned beneath the danger zone after Washington and Tokyo completed a rare joint intervention to defend the yen. The uptrend survives, only a close below 155 exposes 152 and then 149, the floor of the multi-year channel, but the topside is now officially contested. JPMorgan research puts the intervention threshold around 155–160 and still projects a year-end level of 164, while ING looks for 153 and Scotiabank 150, all spring-vintage calls. The pair’s market potential above 160 is real, but so is the risk of meeting two treasuries head-on. The cleanest tell is the relationship between US yields and price: hawkish minutes that lift the 10-year would force the 160 question fast. Until it’s answered, fading strength into 159.8–160.0 remains the tactical playbook.
GBPJPY
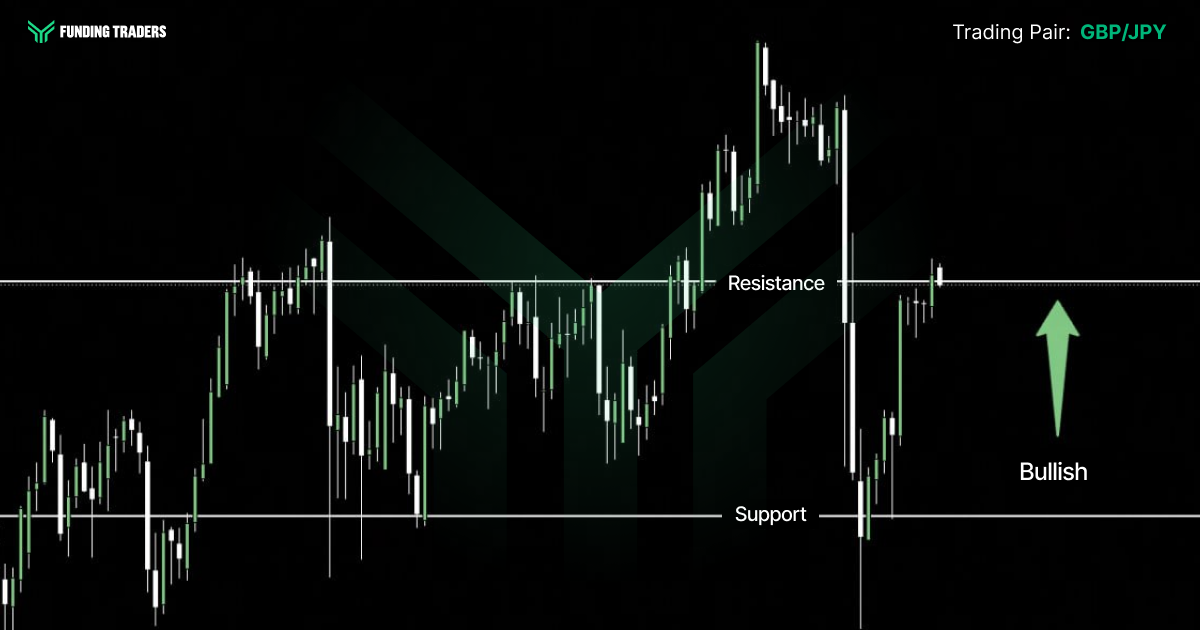
The cross trades around 215.1–215.5, pressing cycle highs on persistent yen weakness. The UK now delivers its densest news run in months — jobs Tuesday, CPI Wednesday, retail sales Friday, a sequence that has historically compounded sterling rate repricing. July’s headline CPI is expected to tick higher on the latest utility price-cap adjustment, keeping the Bank of England’s hawks and doves locked in debate. Japan answers with its own July CPI on Friday, giving the yen side a live catalyst too. Levels: the former 213–214 ceiling is first support, 211.5 beneath; above the highs is open air. Bias: bullish, but the risk cuts both ways, position sizing matters more than direction here, and there is no shame in trading smaller until Wednesday clears.
USD/CHF and AUD/USD
The franc remains the quality haven of this cycle. USD/CHF sits near 0.8126 with a 0.8103–0.8144 day range, and monthly projections frame August inside roughly 0.800–0.835. The SNB has stayed conspicuously quiet even with inflation near zero and the trade-weighted franc at multi-year extremes, while the blockade persists, rallies likely keep getting sold.
The Aussie is the opposite trade. AUD/USD reached 0.7083 into the weekend, near multi-week highs and up roughly 9% in a year, with the RBA’s restrictive stance visibly working according to Assistant Governor Kent. The bank held at 4.35% for a second month and lifted its unemployment forecast to 4.5% by end-2026, so Thursday’s July jobs report, forecast near a modest 10k gain, is the pressure point. Thursday’s China loan prime rate decision matters too, given the China linkage. Levels: support near 0.7025, resistance 0.709–0.710. Bias: mildly bullish, with a trap door under a soft jobs print.
WTI Crude Oil
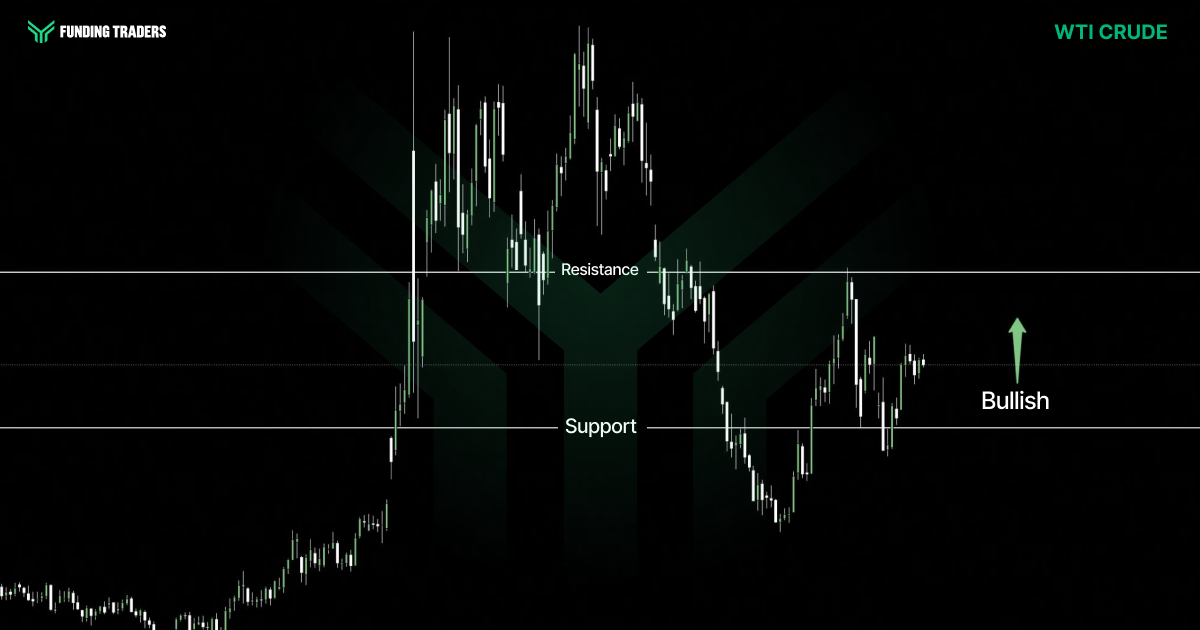
Crude finished last week above $81, up nearly 5%, after the Treasury signaled unprecedented economic measures against Iran while maintaining the naval blockade of its ports; US officials say up to 9 million barrels a day still transits the waterway. The IEA lowered its demand outlook yet sees supply falling about 4.3 million barrels a day this year, the widest deficit in five years. Tehran says an Oman-brokered shipping corridor is close, though it would not restore flows immediately. The tug-of-war between genuine shortage and a diplomatic off-ramp is the whole trade.
On the forecasts, the EIA projects Brent averaging about $85 in the third quarter, easing toward $78 by year-end and $69 across 2027 as shut-in output returns, with roughly 0.6 million barrels a day of disruption persisting through next year. Rabobank strategists note Brent has swung between roughly $72 and $102 since June’s memorandum of understanding, chasing every rumor. Technically, a hammer printed at $80.53 support, and the projected August band is extreme at $67.93–$106.74. Volume spikes around headlines are the norm, trade with stops you actually honor, and watch Wednesday’s US inventory data.
Key Economic Events: August 17 – August 21 (GMT+3)
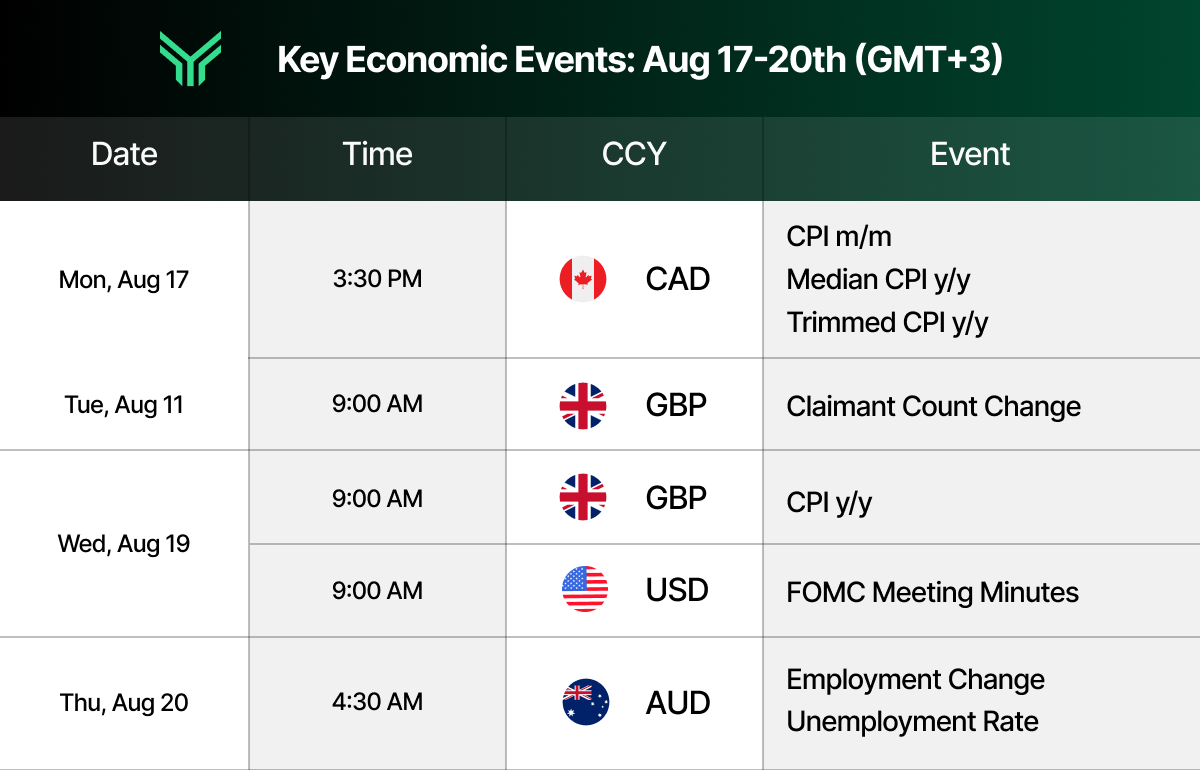
This condensed calendar is adapted from the Forex Factory economic calendar at forexfactory.com, a leading resource professional traders use to track market‑moving macro news and central bank events in real time.
Asset Watchlist: Market Intelligence Snapshot
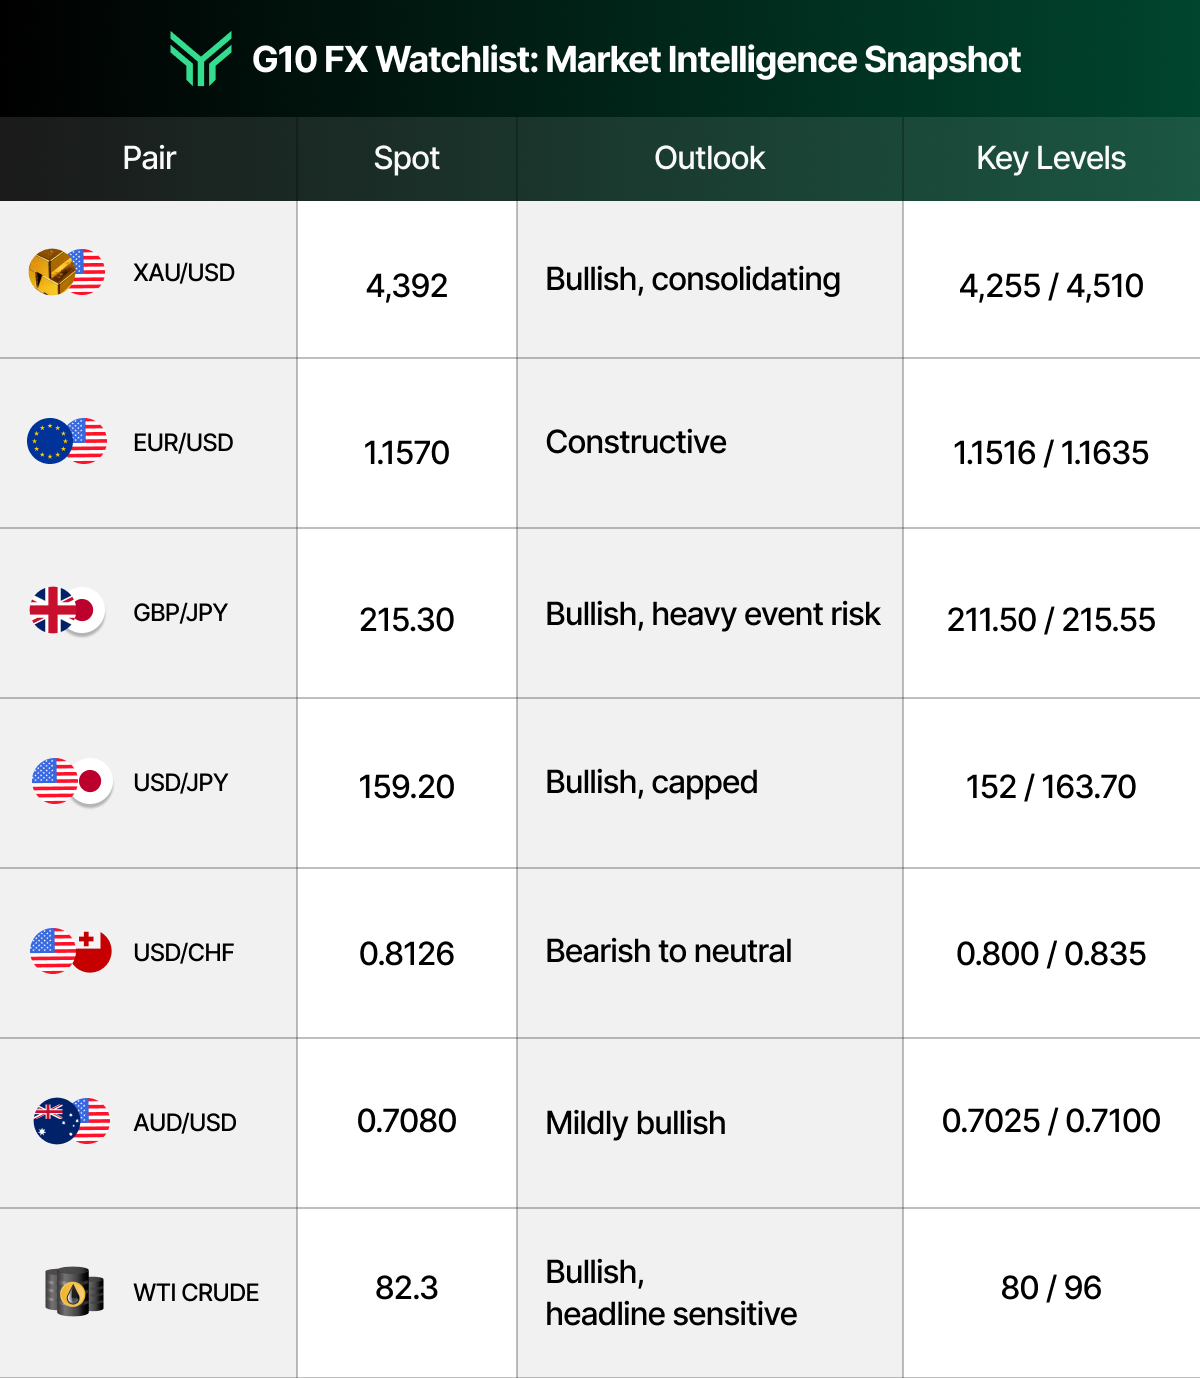
All levels are drawn from current technical research and are reference points, not guarantees.
Actionable Insights for the Week to Drive Growth
Preparation is the trader’s real edge this week, hope is not a strategy, and this calendar punishes improvisation. Weeks like this are why prop capital exists, but they demand the basics of prop trading: keep every idea inside your risk parameters, protect the drawdown and daily-loss limits on each account, and remember leverage cuts both ways across the trading days ahead.
Phase One (Fed stays on hold, blockade grinds on): buy gold dips into $4,340–$4,313 with profit targets at $4,441–$4,450, a daily close under $4,255 invalidates, while a confirmed break of $4,450 opens $4,510. Favor WTI longs on pullbacks toward $80.50 with tight stops given headline exposure, first target $85 per Traders Union’s weekly model. Stay constructive on EUR/USD above 1.1516 targeting 1.1635, and stand aside below 1.1438. Fade USD/JPY strength into 159.8–160.0 while intervention caps the pair, covering toward 155. Equity dips remain for buying while volatility stays subdued, just keep size honest through earnings. This two-phase structure is a comprehensive methodology in miniature: define the base case, identify the triggers that change it, and pre-commit your response so sense replaces emotion when headlines hit.
Phase Two: hawkish minutes revealing a live hike bias would bid the dollar, press gold toward $4,255, send USD/JPY at 160 and stall the record run, analyze the language on energy pass-through before pressing anything. A confirmed Hormuz corridor would unwind the oil premium toward the high-$70s on the EIA’s own path, soften the franc and gold, and broaden risk appetite; that volatility will create opportunity for the prepared. Escalation instead points WTI toward the $90s–$100s within Rabobank’s observed band and gold through $4,450. And a Walmart-week consumer miss triggers the stagflation trade, equities lower even as hike odds collapse.
The standard advice is to wait for the minutes; better to prepare for both outcomes and let the market pick. Keep the economic calendar open on Forex Factory, watch live rate odds on CME FedWatch, and track positioning through the weekly COT report, the same routine institutional desks run for their clients. Access to clean data beats predictions: that is where knowledge compounds into value, and investment opportunities and growth opportunities this dense do not come along every week. To understand the tape is to be paid by it. For a funded trader, a disciplined week like this is business development for a trading business, every evaluation passed and every payout banked compounds, the same way market growth compounds for companies.
You have the two-phase plan, now match it with firm capital built for weeks like this: unrestricted news trading through the minutes and PMIs, weekly payouts, and a scaling plan that rewards consistency. Stack three accounts for the price of one with code EXTRAVAGANZA and put the plan to work. Get funded
Stay Ahead of the Market
The Market Insights frame for the week is simple: records above, cracks underneath, and the Fed’s own words in between. Wednesday tells us how the committee weighs blockade-driven inflation against a softening jobs picture, the retailers tell us how much strain their customers are really under, and Friday’s PMIs tell us whether momentum survived August. Nobody needs to predict all three, they need a plan for each answer.
Global market insights only matter if you can act on them. FundingTraders, a proprietary trading firm built for exactly these weeks, puts serious trading capital behind disciplined traders through a straightforward platform: pass the evaluation, trade your plan with unrestricted news trading, collect weekly payouts, and let the scaling plan turn consistency into size. The future opportunities in a tape like this belong to high-conviction traders who show up funded and prepared for macro setups. Keep following our latest insights as the week unfolds, and step into it with investing capital that matches your preparation.
Weeks like this reward the trader who arrives funded, sized and ready to scale. Claim the Buy One, Get THREE offer with code EXTRAVAGANZA, three accounts for the price of one with a 100% profit split, and make this the week your preparation gets paid. Claim the offer
Disclaimer: Trading involves significant risk and is not suitable for every investor. Past performance is not indicative of future results. The information provided in this article is for educational and informational purposes only and should not be considered financial, investment, or trading advice. All account rules, payout structures, profit splits, and promotional offers described in this article are subject to change at the discretion of FundingTraders. Promo codes may expire or be modified without prior notice. Always trade responsibly and only risk what you can afford to lose.