This week’s market insights matter more than most. The Powell era closes on Friday, the April CPI report lands on Tuesday, and a US-China leaders’ meeting is penciled in for Thursday, three pivot points stacked into five sessions. The Federal Reserve enters with the most divided committee in a generation, the European Central Bank is sitting still, and the Bank of Japan is openly defending the yen. Inflation risks are no longer abstract. With the Strait of Hormuz still constricted, the economic chain runs straight from a tanker in the Gulf to the price on a CPI line, and from that line to every forecast for future Fed cuts. The themes traders need a deep understanding of are simple to name and brutal to position around: inflation, leading central-bank transitions, and the new behaviour of global markets when the safe-haven and risk-on bid argue with each other in the same session. This piece offers our comprehensive view of where the focus belongs, what to watch, and how to act.
Quick Summary Box
The week’s tone is high-stakes consolidation under unusually loud headlines. Gold continues to trade with a constructive bias, helped by sticky inflation commentary and ongoing geopolitical noise, with traders watching whether bullion can stretch toward fresh records or whether a soft CPI takes some heat out of the rally. WTI crude sits in an uneasy holding pattern as the world prices in a closed Strait and a stalled diplomatic track, with each headline from the Gulf able to shift the bias quickly. US equities, the S&P 500 in particular, enter the week at all-time highs after a six-week run, but valuations are stretched and the Fed transition raises the volume on every data point. The dollar index has softened on a mix of intervention pressure from Tokyo, a dovish lean from the incoming Fed chair, and the process of the market repricing rate-cut predictions. The simple read is this: every move this week is being informed by inflation, energy and political transition, and investors should expect outsized swings around scheduled releases. Our latest insights below break this down asset by asset.
Asset Breakdown: Market Research on Global Markets
This section turns the macro narrative into a tradeable view. Each asset is framed with a directional focus, the levels that matter, and the events that could reveal which side wins.
XAUUSD (Gold)
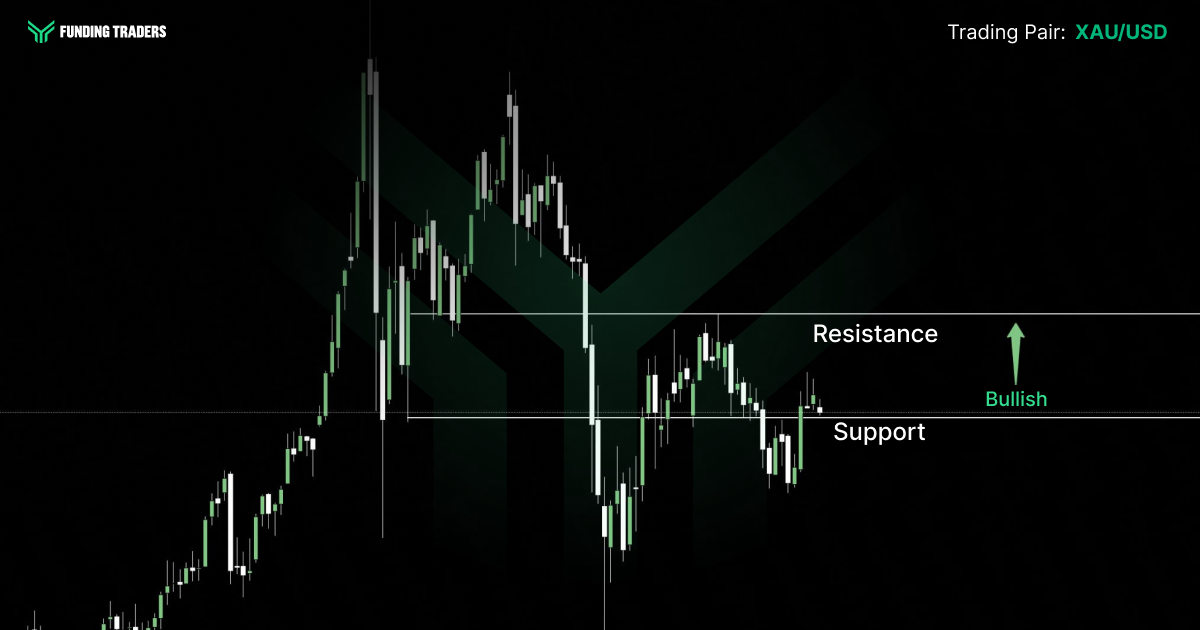
Gold is trading in the $4,700s after a sharp rebound from a deep correction earlier in the spring. The setup is clean: the 23.6% retracement near $4,703 has flipped into immediate support, with the 200-period moving average around $4,665 sitting beneath it. To the upside, the swing-anchor near $4,891 is the line that matters most before bulls can openly project a run toward five thousand. Institutional predictions remain striking. J.P. Morgan has reaffirmed a Q4 2026 average near $5,055, with an upgraded year-end target around $6,300. Goldman Sachs sits at $5,400, UBS at $6,200, Bank of America at $6,000, and Morgan Stanley more cautiously at $4,400. The differences come down to how quickly real yields fall and how aggressively central banks keep buying. With the Fed transition in motion and inflation set to come in hot, the path of least resistance remains higher, but a soft CPI surprise is the cleanest catalyst for a corrective leg.
Gold-tier setups don’t come around often, and they shouldn’t be traded on a half-funded account. Get started on a FundingTraders evaluation today and use code FT50 to take 50% off any account size, yes, every size, no caps, no fine print. Skip Phase 1 fees, trade the news without restrictions, and turn this week’s setups into a real payout.
EUR/USD
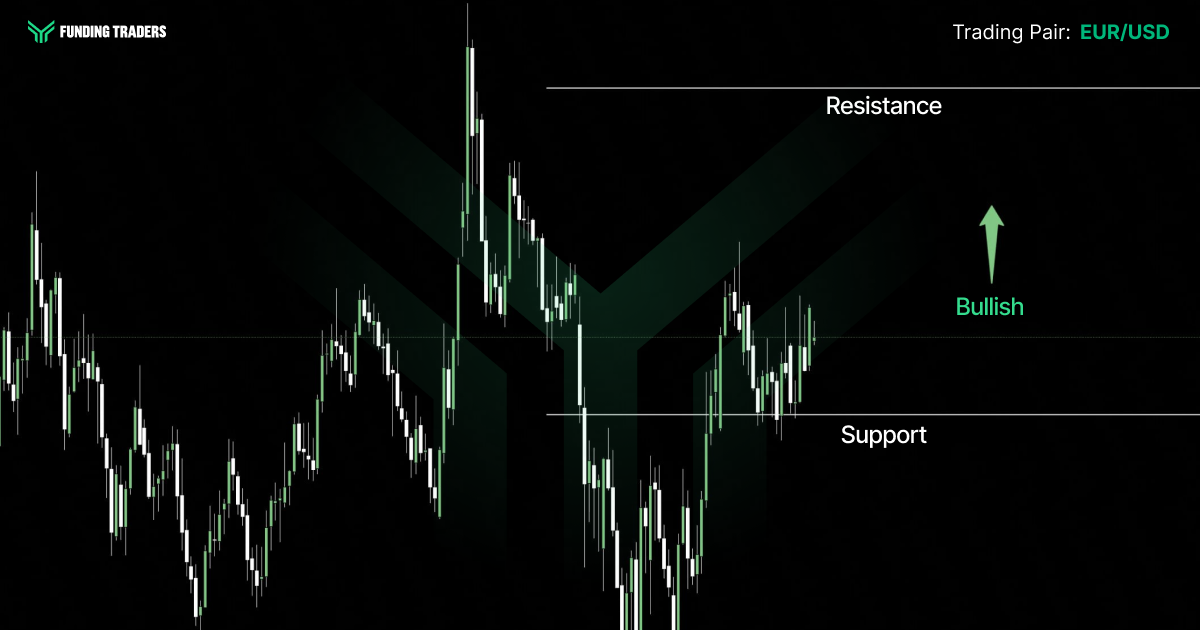
EUR/USD trades near 1.17, holding above the March low at 1.1476 and below the January peak around 1.1974. The Fed sits at 3.50–3.75% and the ECB at 2.00%, leaving a roughly 150 basis-point gap that markets see compressing through 2026. Goldman Sachs estimates each 50bp of compression adds 300–400 pips to the pair. JPMorgan year-end target sits at 1.22, Goldman at 1.25, Morgan Stanley sees a spring spike toward 1.23 before easing to 1.16, and UBS lands at 1.20. The week’s directional driver is straightforward: a hot CPI lifts the dollar and presses the euro back toward 1.1680; a softer print, combined with confirmation that Warsh leans dovish, opens the path toward 1.1800 and then 1.20.
GBP/JPY
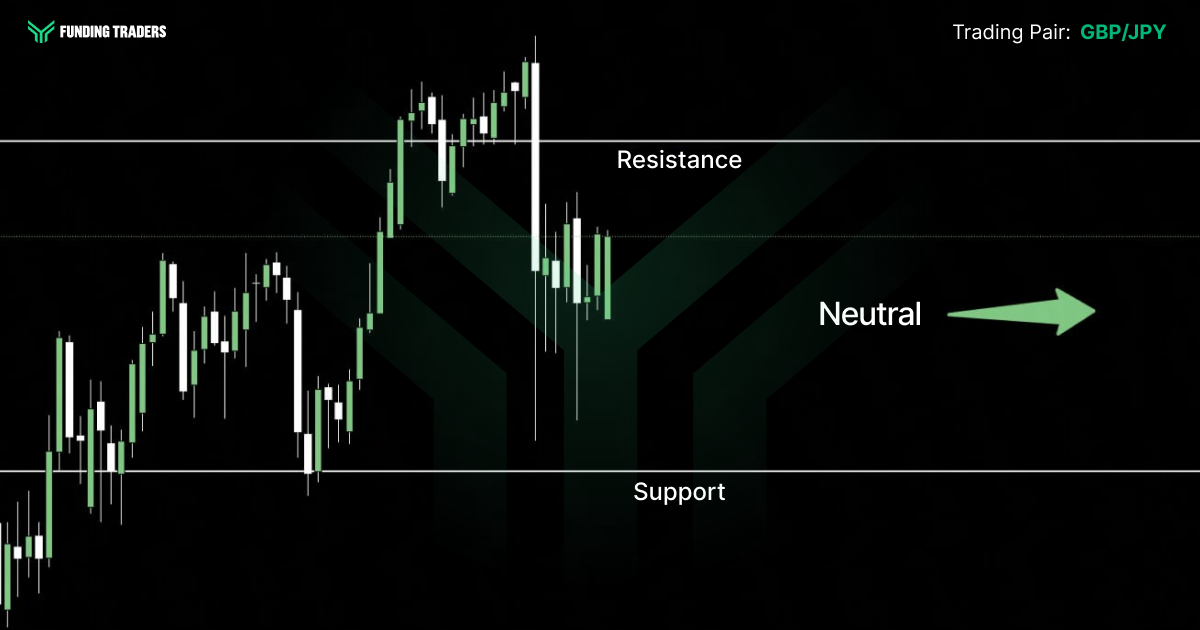
GBP/JPY adds sterling-specific risk to the yen-intervention trade, making it the higher-volatility version of the same setup. The pair rejected 215, pulled back to 210, but held above the 212 neckline of an inverted head-and-shoulders, a structure that keeps the bias constructive as long as 212 caps the downside on a close. Wednesday’s UK monthly GDP is the first sterling catalyst (consensus 0.2% QoQ / 1.3% YoY); a soft print risks reviving BoE cut speculation and dragging the pair back through 212. A firmer print keeps 215 in play, with a break opening the path toward 218. Any second BoJ intervention would likely deliver a sharper move here than on USD/JPY given the carry-trade unwind risk, worth respecting for sizing.
USD/JPY
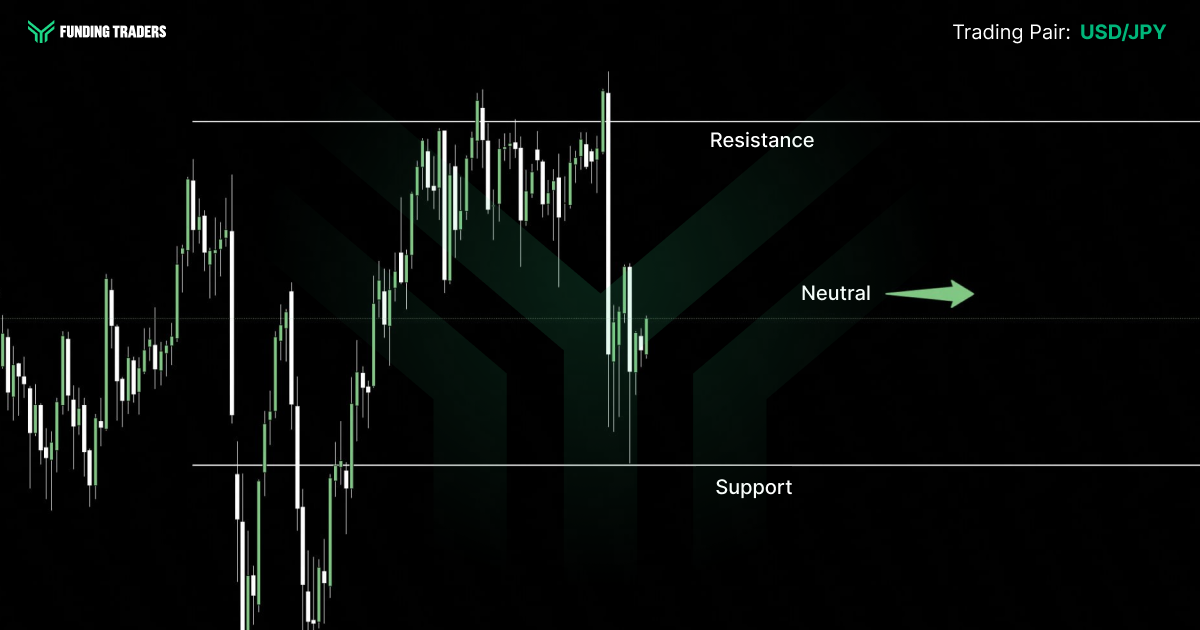
USD/JPY is the most policy-sensitive pair on the board. After Tokyo intervened in early May with roughly $35 billion of yen-buying, the pair rebased near 156.85 from a spike above 160, and the BoJ has signaled it stands ready to act again. JPMorgan remains the outlier with a 164 year-end target; ING sees a 155–160 range with intervention risk near the top; OCBC ends the year at 155. Support sits at 155 then 152, with the long-term uptrend running through that zone. Resistance is 158 and then the 160 intervention shelf. Monday’s BoJ Summary of Opinions and Tuesday’s US CPI will set the tone, any rally toward 160 should be treated as a binary on whether Japanese authorities defend the line a second time inside a month.
USD/CHF and AUD/USD
USD/CHF sits near 0.78, with UBS modelling stabilisation around that level into year-end. The SNB has flagged interest-rate differentials as a focus, leaving the franc with limited room to weaken meaningfully unless safe-haven flows reverse. AUD/USD trades near 0.7225 after the RBA’s third straight 25bp hike on May 5 took the cash rate to 4.35%, the highest in the G10. Support sits at 0.7190 and resistance at 0.7260 then 0.7320. The Aussie remains the cleanest expression of the “RBA hawk vs. risk-off” tension this week.
WTI Crude Oil
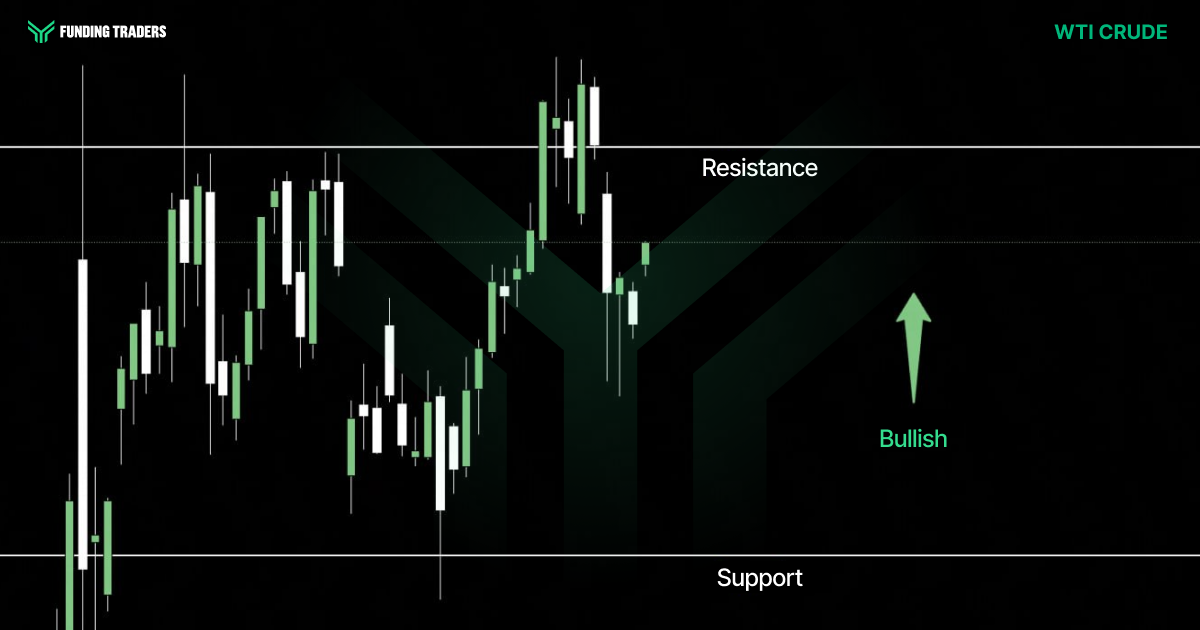
WTI crude has been the most volatile macro asset of 2026, and last week it traded around $94–$95 after Brent settled near $100. The Strait of Hormuz has been effectively closed since late February, the US naval blockade of Iranian ports has been extended indefinitely, and the International Energy Agency estimates the conflict has removed roughly 14 million barrels per day of effective supply. Technically, a sustained break above $115 on WTI opens the path toward $130 and a tail-risk move to $150. To the downside, $90 is now the bull-bear pivot, with Energy Aspects’ Amrita Sen calling $80–$90 the new floor going forward. The EIA’s Short-Term Energy Outlook expects Brent to peak in Q2 2026 around $115/b before easing. Goldman Sachs has flagged thinning naphtha, LPG and jet-fuel buffers, particularly in Asia. The trade this week is event-driven: any progress on a Hormuz reopening risks a violent drop, while any further escalation will be sold by no one.
Key Economic Events: May 11 – May 15(GMT+3)
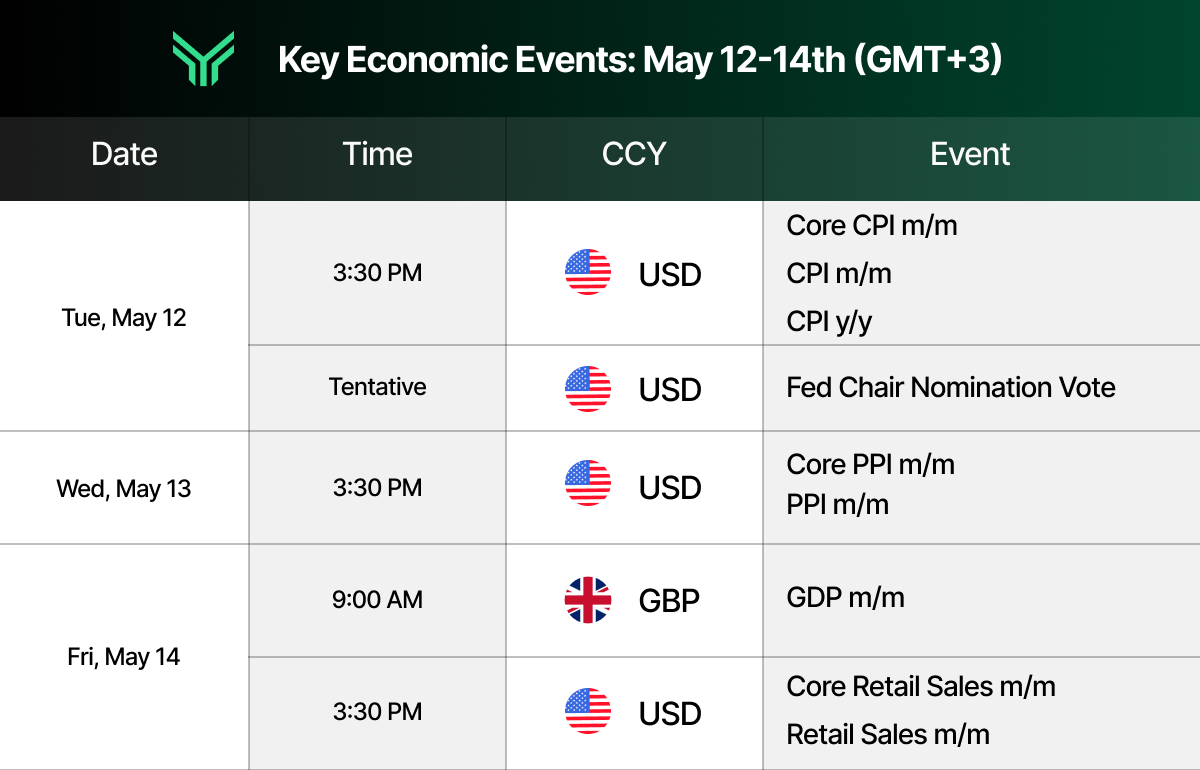
This condensed calendar is adapted from the Forex Factory economic calendar at forexfactory.com, a leading resource professional traders use to track market‑moving macro news and central bank events in real time.
Asset Watchlist: Market Intelligence Snapshot
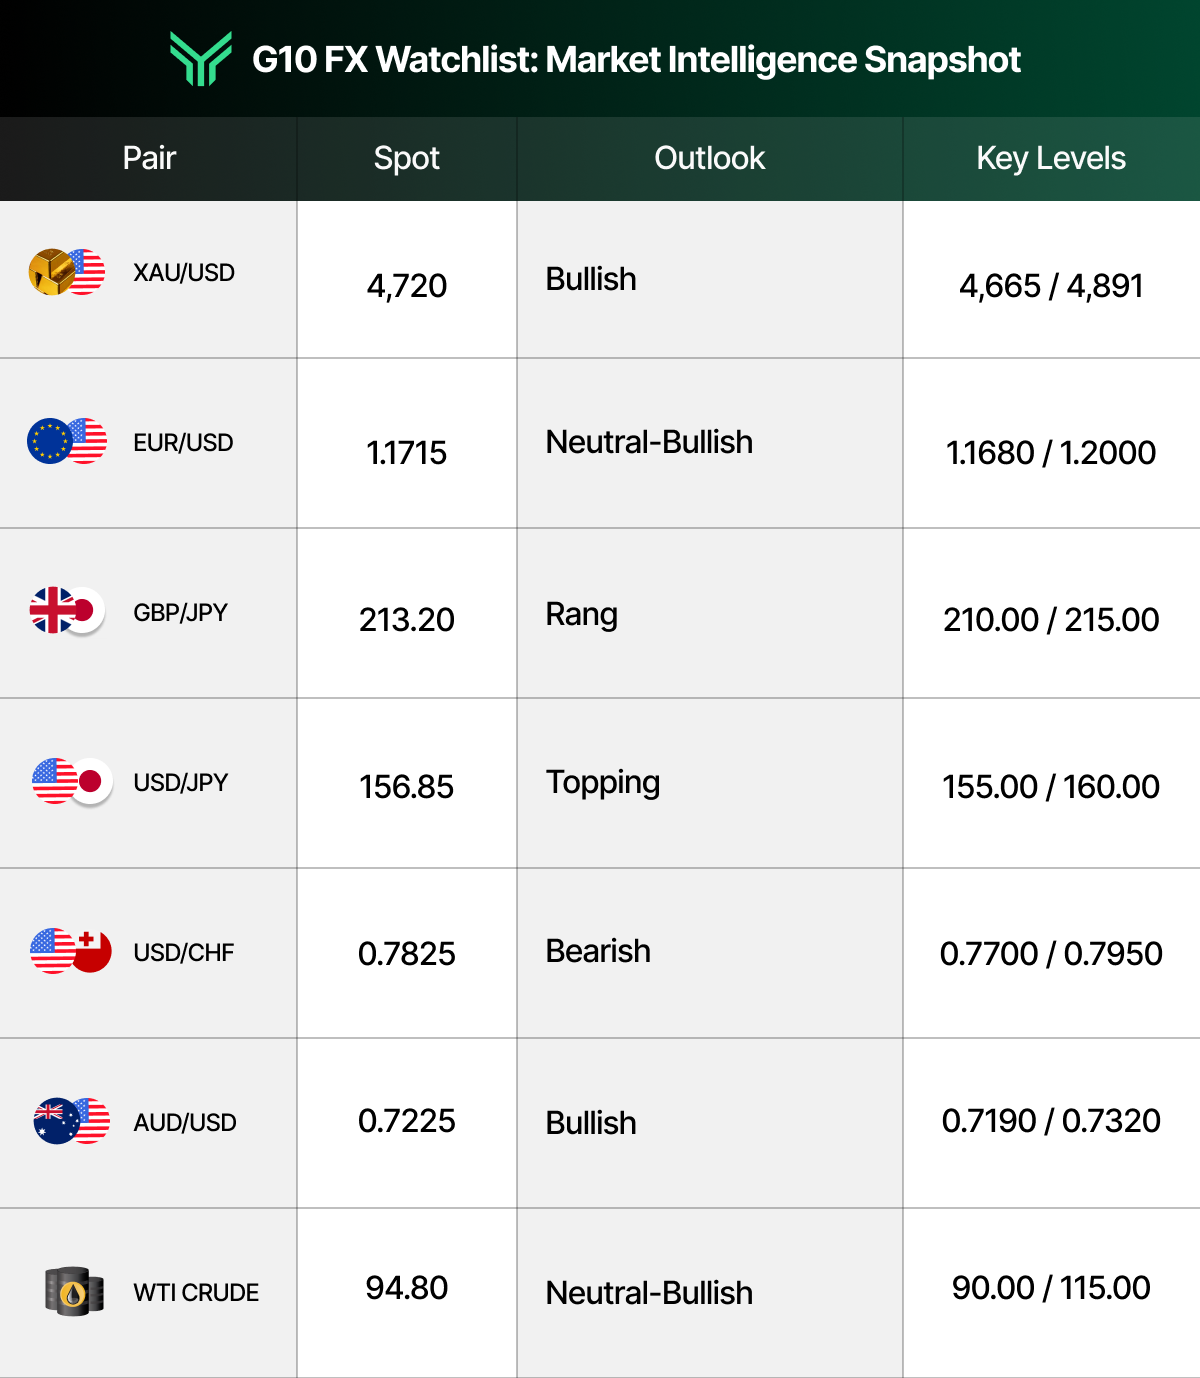
This table delivers market insights at a glance, helping traders quickly analyze key levels and understand current trends.
Actionable Insights for the Week to Drive Growth
Preparation, not prediction, is what separates traders who compound from traders who guess. This is the quarterly market update distilled into a working playbook for the week, with the kind of actionable intelligence dedicated retail and professional traders actually use to size positions and frame risks.
Base Case. Inflation prints near consensus, the Senate confirms Warsh, the US-China meeting produces vague positives, and Hormuz remains closed but quiet. Under that script, the working trades are: long gold dips toward $4,665 with $4,891 the first target; long EUR/USD on closes above 1.1750 toward 1.1900–1.2000; long S&P 500 above 7,342 with 7,584 in scope; and short USD/JPY rallies into 158 with 155 then 152 the targets. WTI stays range-bound between $90 and $105.
Triggers that flip or deepen the thesis. A hot core CPI print above 0.3% MoM revives “higher-for-longer” pricing, long dollar across the board, short gold toward $4,500, short S&P 500 toward 7,342 then 7,124. Any concrete Hormuz reopening framework, WTI down toward $80, gold sold, equities rip. Any further BoJ silence as USD/JPY presses 160, set alerts for a second intervention, which has a track record of producing 300–500 pip moves inside an hour.
This is the week where preparation pays. If your sizing and rules are dialed in, you don’t need to call every move, you just need to be in the seat. Spin up your FundingTraders evaluation now with FT50 and unlock a flat 50% discount on every account size. Up to 90% profit split, weekly payouts, news trading allowed. The promo code is the kicker; the platform is the engine.
Stay Ahead of the Market
The week of May 11–15, 2026 forces a decision in markets that have spent six weeks comfortably grinding higher. Inflation, a Fed transition, energy supply, and a US-China meeting are not the kind of risks markets normally process in a single five-day window. The market insights that matter now are the ones that map each scenario to a defined trade, with clear invalidation levels and a sized response to news.
FundingTraders is built for exactly this kind of tape, a platform where clients can express high-conviction macro views with unrestricted news trading, weekly payouts, and a scaling plan that rewards edge rather than passivity. The goal is to stay ahead of the next print, not chase it. Use this week to refine the process: pre-defined levels, pre-defined sizing, pre-defined exits. Track the events, analyze the reaction, and let the data reveal the opportunities.
Don’t watch this week from the sidelines. Code FT50 unlocks 50% off any FundingTraders evaluation, a discount that genuinely changes the math on how fast you can scale. One code. Any account size. Real capital, weekly payouts, no news-trading restrictions. Claim it before the CPI print.
Disclaimer: Trading involves significant risk and is not suitable for every investor. Past performance is not indicative of future results. The information provided in this article is for educational and informational purposes only and should not be considered financial, investment, or trading advice. All account rules, payout structures, profit splits, and promotional offers described in this article are subject to change at the discretion of FundingTraders. Promo codes may expire or be modified without prior notice. Always trade responsibly and only risk what you can afford to lose.