Welcome to the Market Insights edition for the trading week of May 4–8, 2026, a week where the world’s biggest macro stories all sit on the same desk at the same time. The Strait of Hormuz is still effectively closed. The Bank of Japan has just stepped into the market to defend the yen for the first time in years. The Federal Reserve has held rates with the deepest internal split in three decades, and the European Central Bank is openly highlighting a return to hikes if energy-driven inflation does not cool. This is no longer a slow grind; it is a layered macro story where geopolitics, central bank policy, and labor data are all pulling in different directions. Our goal in this report is to inform your week, explore what is actually moving, and deliver the insights traders need to gain an edge before the NFP print closes the week.
Quick Summary Box
The tone heading into the week is cautious and bullish, with risks stacked on both sides of every major asset.
Gold continues to act as the world’s preferred safe haven, with the bias still tilted higher even as bulls process a recent stall near resistance. WTI crude is the structural story, holding firm in a higher range as the Hormuz disruption keeps the supply premium intact. US equities, led by the S&P 500, are quietly back in leading form after the strongest monthly gain since 2024, propped up by resilient earnings and the hope that the Fed eventually blinks. The dollar (DXY) is stuck in a tug-of-war between hawkish Fed dissents and yen-led short-covering. Across the board, traders should focus on how the energy shock filters through to economic data, because that single thread is what ultimately decides where every one of these assets prints next.
Asset Breakdown: Market Research on Global Markets
This section turns the macro narrative into a tradeable view. Each asset is framed with a directional focus, the levels that matter, and the events that could reveal which side wins.
XAUUSD (Gold)
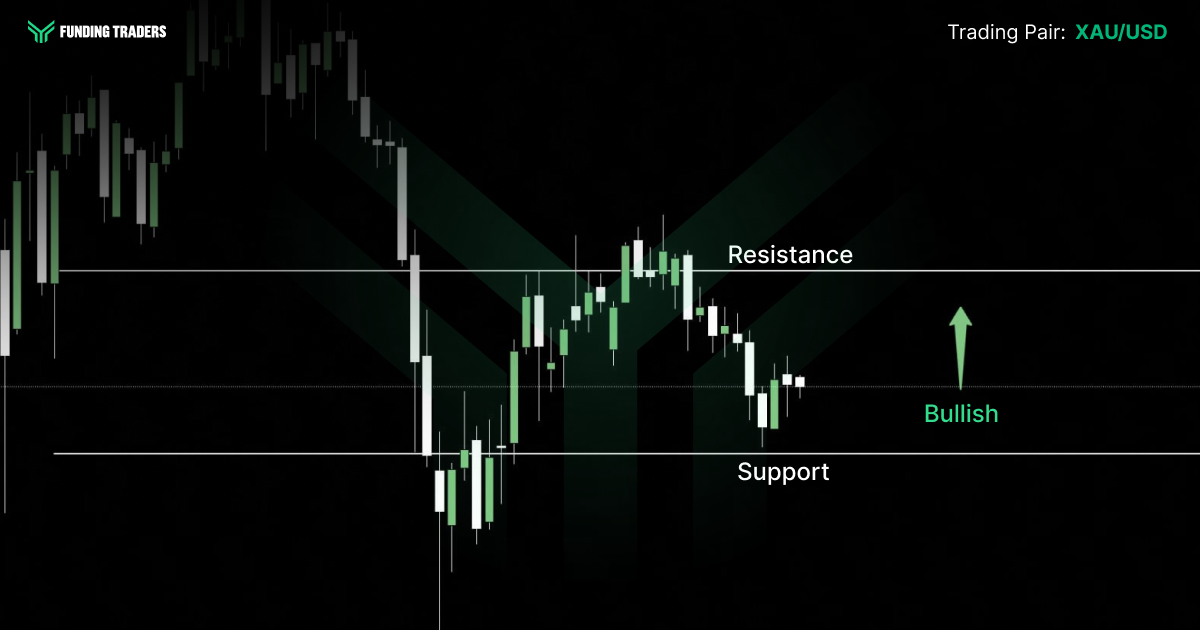
Gold enters the week trading near $4,621, consolidating after a powerful run that pushed the metal to a record $5,595 high in late January. The deep understanding here is that gold’s bullish architecture is intact, central bank buying, Hormuz-driven safe-haven flows, and persistent inflation are all still in play. A recent Reuters analyst poll lifted the 2026 median gold forecast to $4,916 per ounce, while JPMorgan now sees an average price of $5,200–$5,300 by mid-2026. The line in the sand is $4,600 support; lose it on a closing basis, and traders should brace for a complex retracement toward $4,500–$4,450. Reclaim $4,800, and the next leg toward $4,916 opens.
EUR/USD
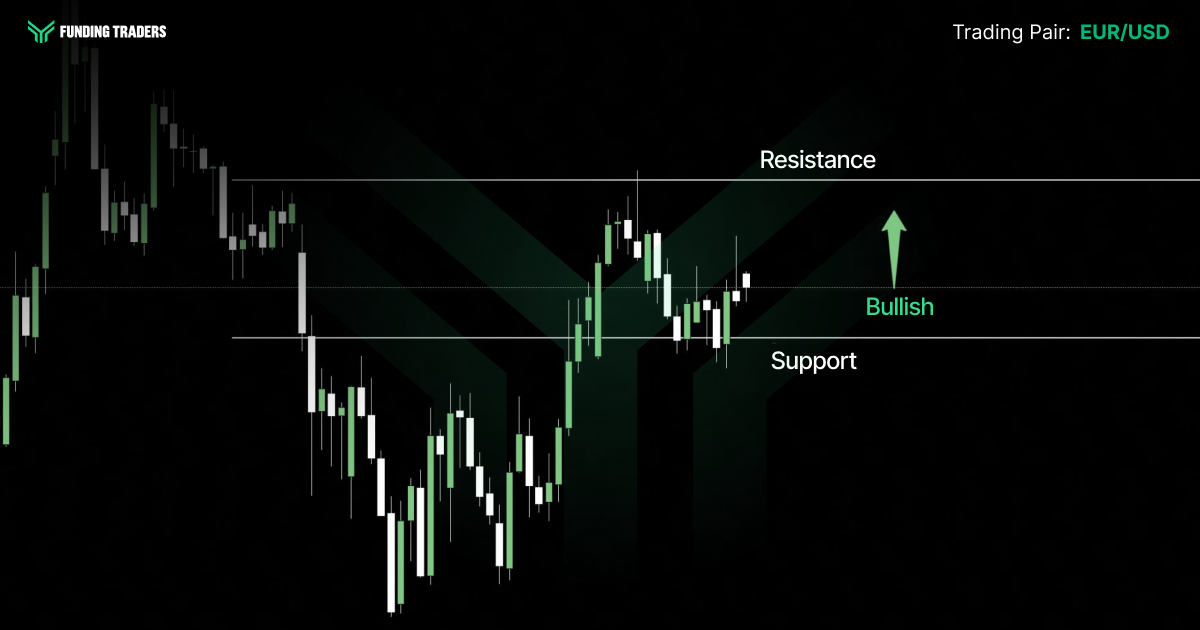
The euro is trading around 1.1716, recovering from three-week lows after the ECB hinted at a possible June hike. Goldman Sachs has reiterated a 1.25 EUR/USD target by year-end, while ING projects 1.21 by Q4 2026. The competition between a dovish-leaning Fed and a suddenly hawkish ECB is exactly what FX analysts want to analyze this week. Bias remains constructively higher on dips into the 1.1685–1.1633 pocket, with the ceiling at 1.1840.
GBP/JPY
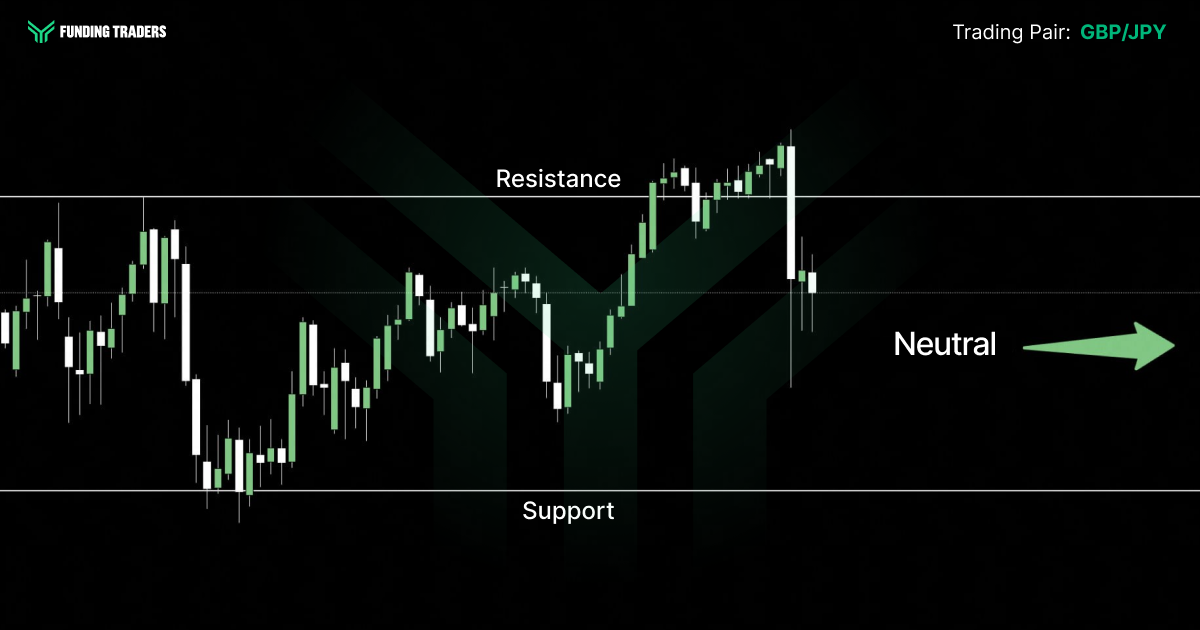
GBP/JPY remains the single most explosive cross post-intervention. Sterling rejected 215 resistance and is finding support at 210, with the 212 inverted head-and-shoulders neckline keeping bullish structure alive. The future of this pair lives and dies in Tokyo. Another BoJ round of intervention could deliver a violent flush; further oil-driven yen weakness keeps 215 in play. Treat this as a tactical pair, not a trend pair; the volume of intervention risk is too high.
USD/JPY
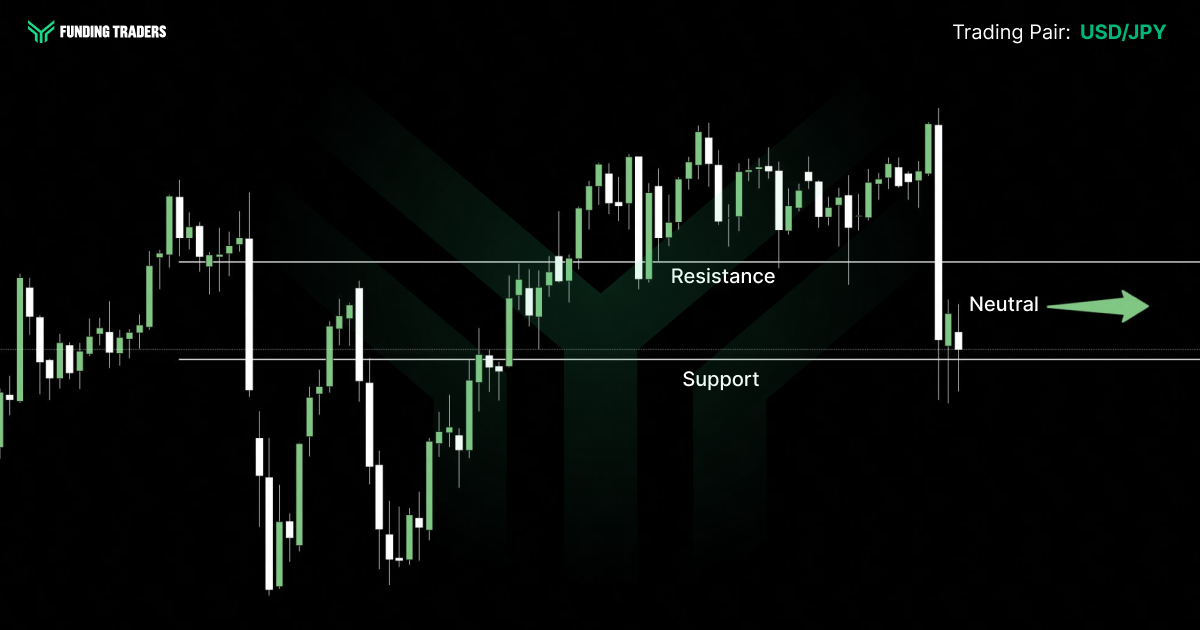
USD/JPY is the single most politically charged pair in the world right now. After Japan’s Ministry of Finance intervened on April 30 and May 1 with an estimated $30B-plus operation, USD/JPY snapped from above 160 down toward 156. Resistance now sits at 157.89–158.00, and support at 156.27. JPMorgan still holds the most bullish strategist call at 164 by year-end 2026, but the path will not be linear. Trade the range, not the breakout, until the BoJ’s next move is clear.v
USD/CHF and AUD/USD
The Swiss franc remains supported by safe-haven demand and an SNB that has signaled willingness to intervene if needed. USD/CHF is rangebound, with predictions skewed toward continued franc strength while Hormuz is hot. AUD/USD, by contrast, is trading near 0.72, a four-year high, into Tuesday’s RBA decision. Markets expect a 25bp hike to 4.35%, the third straight increase, with year-end forecast climbing toward 4.60%. A dovish-leaning hike could spark a quick “buy the rumor, sell the fact” reversal.
WTI Crude Oil
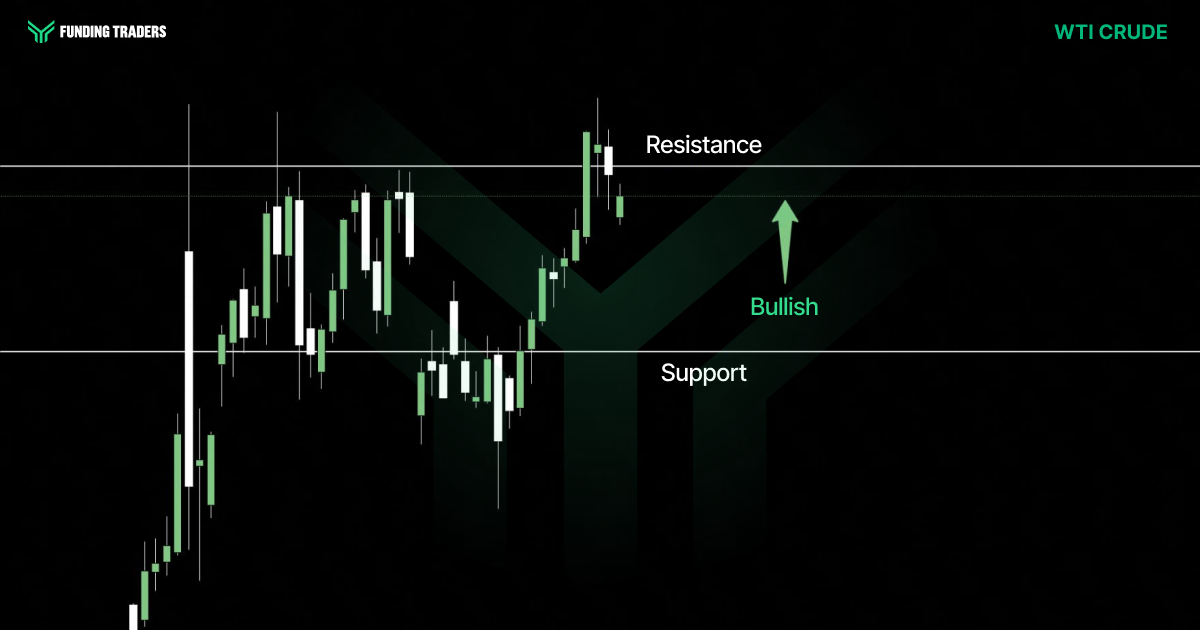
WTI is the structural macro trade of the week. With the Strait of Hormuz still closed and 9.1 million barrels per day shut in during April, WTI is trading near $106 a barrel. The EIA’s STEO sees Brent peaking near $115 in Q2 2026 before easing. Goldman Sachs has revised its forecast higher, expecting Brent to average above $100 for 2026. Support holds at $103.30; lose it, and the energy thesis weakens. Hold it, and a push toward $110 is the logical next step. Thursday’s EIA inventory print is the pivotal, timely catalyst.
If you can read an oil tape this clean, you should be trading it on real capital, not your own. Skip the lecture-room rules. FundingTraders gives you unrestricted news trading, weekly payouts, and up to 90% profit splits on a single-step evaluation. Use code FT50 at checkout for 50% off any account size; that’s not a coupon, that’s half your funding fee gone before you place your first trade. Lock it in.
Key Economic Events: May 4 – May 8(GMT+3)
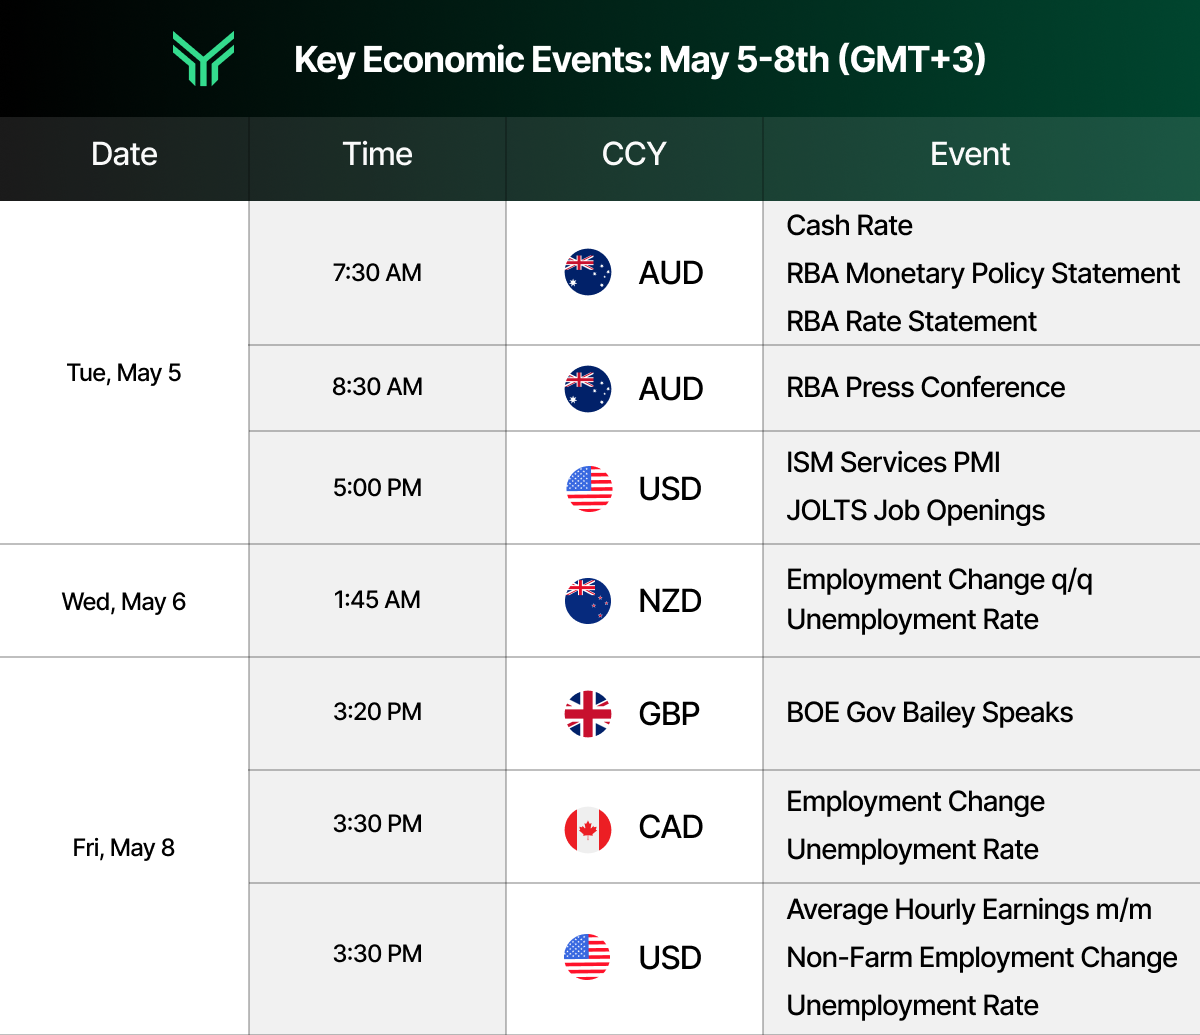
This condensed calendar is adapted from the Forex Factory economic calendar at forexfactory.com, a leading resource professional traders use to track market‑moving macro news and central bank events in real time.
Asset Watchlist: Market Intelligence Snapshot
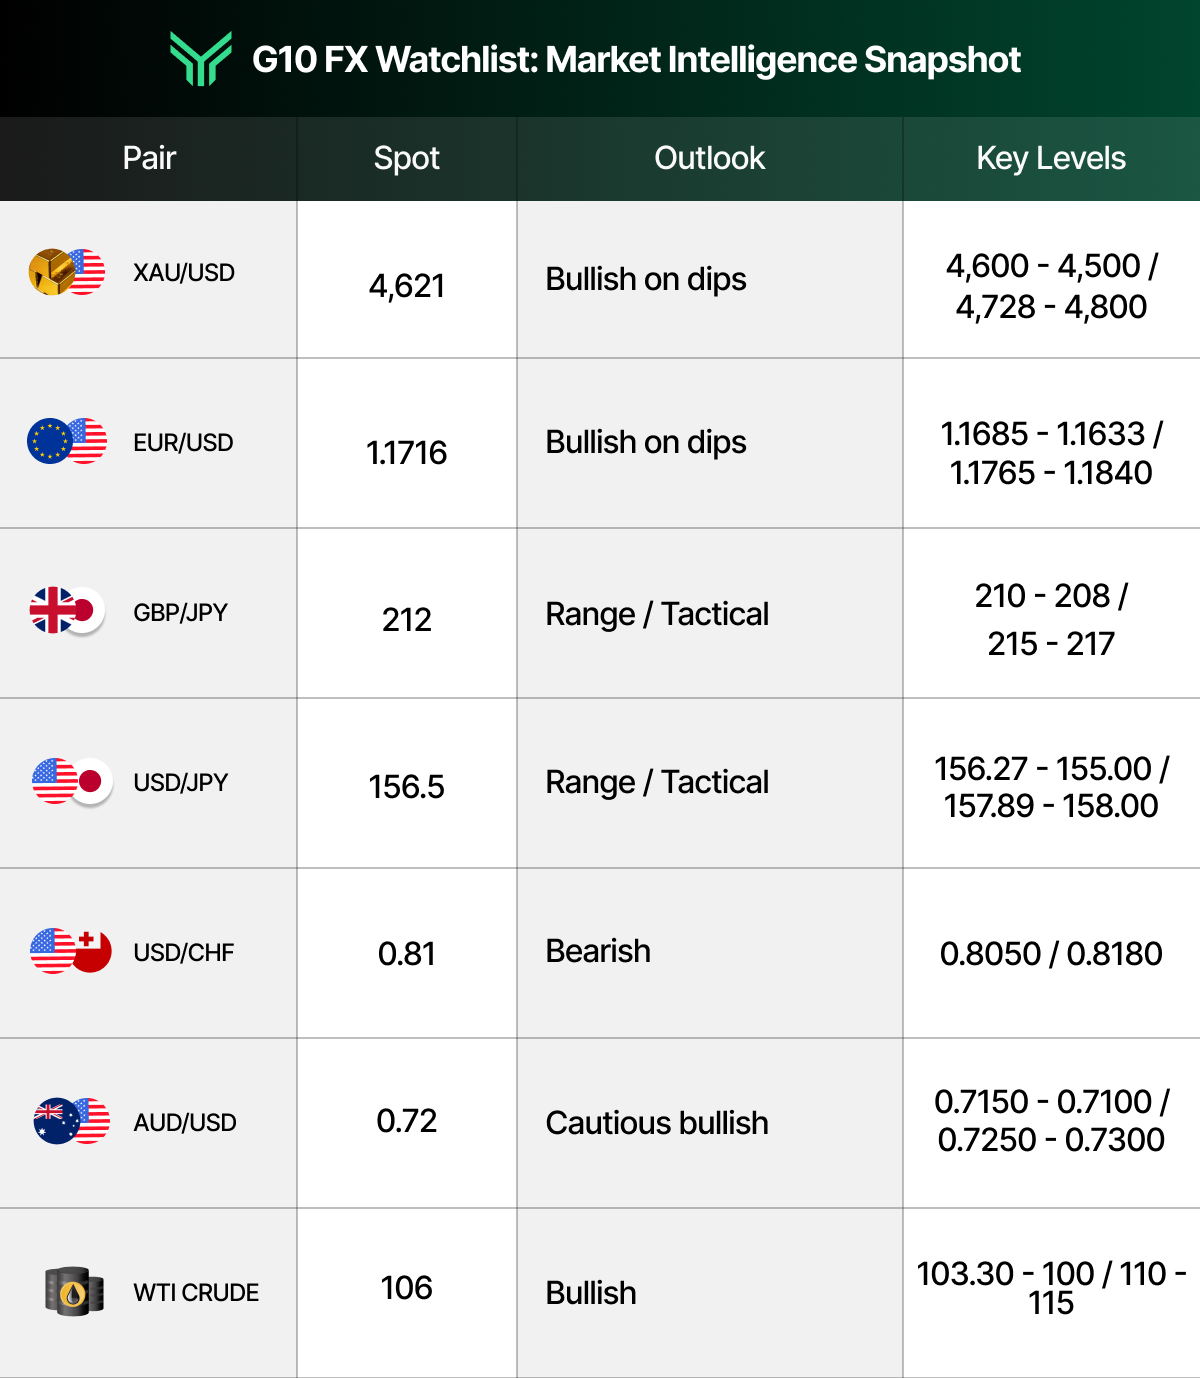
This table delivers market insights at a glance, helping traders quickly analyze key levels and understand current trends.
A watchlist is only worth what you can actually trade. If your current funded program restricts holding into NFP, blocks news trades, or caps your daily target, you’re leaving the best two days of the week on the table. FundingTraders was built by traders who hated those rules. FT50 drops your evaluation cost in half, same scaling plan, same payout schedule, same profit split. The only thing smaller is your entry cost. Claim the deal.
Actionable Insights for the Week to Drive Growth
Preparation is the trader’s only durable edge. Conviction without a plan is just hope wearing a suit.
Base Case:
Long gold on dips into $4,600, targeting $4,728/$4,800. Stop below $4,540.
Long WTI while $103.30 holds, targeting $110/$115. Stop on a daily close below $100.
Long EUR/USD on dips toward 1.1685, targeting 1.1840. Stop below 1.1620.
Range-trade USD/JPY between 156.27 support and 157.89 resistance, do not chase breakouts; support is policy, not technical.
Cautiously long S&P 500 into NFP, with hedges. Earnings are fine; the data is the wildcard.
Triggers:
A credible Hormuz reopening or Iran-US deal: gold and oil both unwind hard; risk assets rip.
A weak NFP print (<50K) or rising unemployment: dollar sells off, gold surges, yen strengthens.
A hot NFP (>150K) with sticky wages: Fed cut bets fade; DXY rallies; gold stalls; yen weakens again into intervention territory.
A second BoJ intervention round: violent yen-cross flushes, GBP/JPY most vulnerable.
Use your own framework, your research tools, and a clear playbook for each scenario before Tuesday’s open. Quality of preparation will outperform quantity of trades every time.
Stay Ahead of the Market
This is one of those weeks that decides a quarter. The Hormuz energy shock is still pressing inflation higher across geographies, central banks are no longer aligned, and the Friday NFP will lock in or unwind every position the market built in April. Our Market Insights for May 4–8 frame the macro context, but execution is yours.
For investors and active traders, the process is the same: access the data, build a comprehensive view, define your risks, and trade your edge. FundingTraders exists for exactly this kind of week, when high-conviction macro setups need a dedicated capital partner that lets you implement your plan without artificial restrictions.
The trade idea is yours. The capital should be too. Ride this week’s setups on a funded account with weekly payouts, full news-trading rights, and a scaling plan that actually rewards consistency. Use FT50 at checkout, and you’ll cut the cost of every account size in half. This includes Phase 1 evaluation, Phase 2, and instant funding. It is the most generous discount we offer, and it stacks on top of every other benefit. Start your evaluation today.
Disclaimer: Trading involves significant risk and is not suitable for every investor. Past performance is not indicative of future results. The information provided in this article is for educational and informational purposes only and should not be considered financial, investment, or trading advice. All account rules, payout structures, profit splits, and promotional offers described in this article are subject to change at the discretion of FundingTraders. Promo codes may expire or be modified without prior notice. Always trade responsibly and only risk what you can afford to lose.