This week’s market insights begin with a puzzle: stocks just set record highs because the jobs report was bad. A shrinking labor market convinced traders the Federal Reserve may hold off on another rate hike, and that hope, not strength, powers the rally. Wednesday’s inflation report is judge and jury, while two fragile props hold everything up: a joint push by Washington and Tokyo to defend the yen’s value, and talks to reopen the Strait of Hormuz for oil. Our latest insights below turn noise into a plan: global market insights on the data, the trends, and the new risks shaping gold, oil, currencies, and stocks, so traders enter the week ahead with confidence, not guesswork.
Quick Summary Box
The tone is hopeful but fragile: world markets lean on soft jobs numbers and diplomacy, and one hot inflation print could kick both crutches away. Gold sits just under recent highs with a buy-the-dip bias; the midweek inflation report decides breakout or pullback toward trend support. Crude hovers above last week’s lows, neutral and headline-driven, Hormuz progress caps prices, tanker attacks lift them, and volume clusters around the news. The S&P 500 is bullish in record territory behind strong technology earnings, though the quality of that rally gets tested midweek. The dollar index leans bearish near recent lows on fading hike odds and the yen rescue.
Asset Breakdown: Market Research on Global Markets
Gold (XAUUSD)
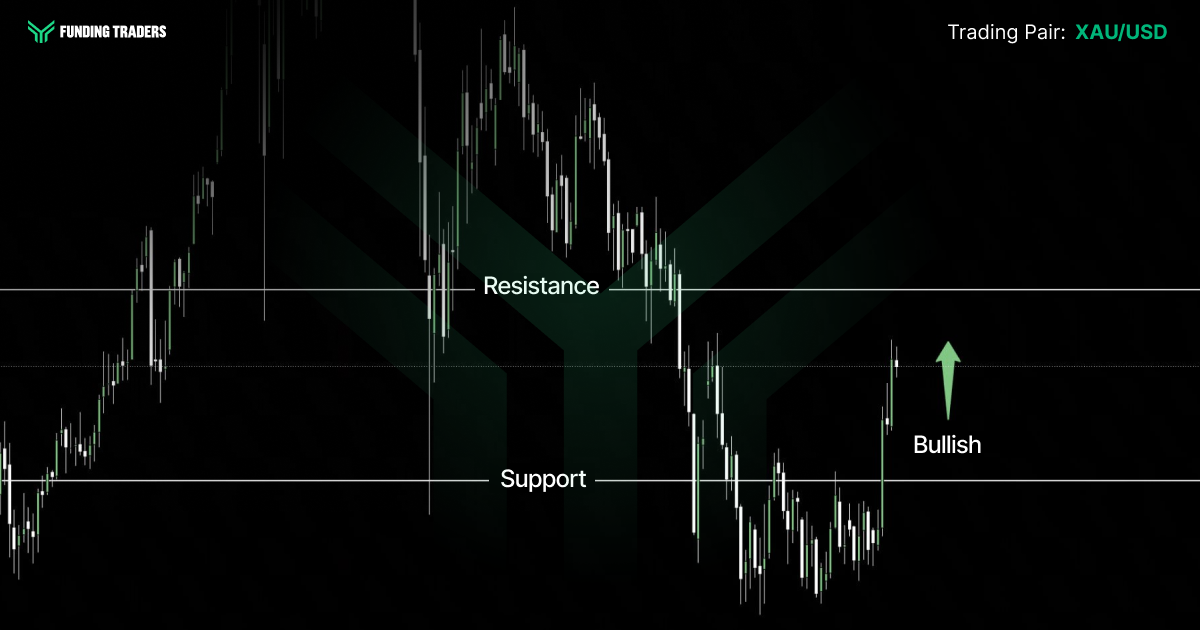
Gold opens near $4,300, easing off Friday’s seven-week high of $4,372 after a 7% weekly surge. The fuel: a jobs report showing the US economy lost 23,000 jobs in July against forecasts for an 80,000 gain, slashing September hike odds to about 44% from 55%.
The structure favors buyers: gold reclaimed its 50-day moving average at $4,152 and is coiling between $4,328 and $4,350, with the 100-day average near $4,390 overhead.
Wednesday decides it, analysts expect headline inflation to ease to 3.4% from 3.5%. A soft print opens $4,450–$4,500; a hot one drags gold back to $4,152. Goldman Sachs’ latest note to clients (June) targeted $4,900 by year-end, warning an actual hike could pull prices toward $4,400. Buy-the-dip remains the base case until the 50-day gives way.
A setup this clean deserves real size behind it. This month, code EXTRA gets you 50% off plus a FREE account on $100K+ evaluations, with a 100% profit split on everything you earn. Claim it before the CPI candle prints.
EURUSD
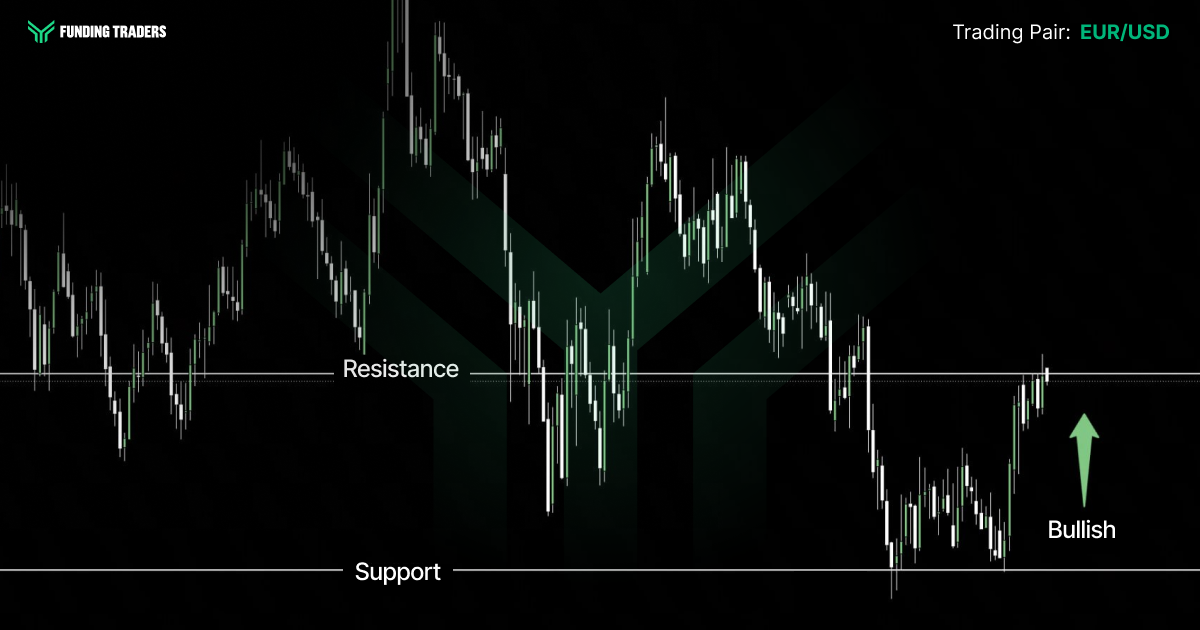
The euro enters the week near 1.15 after a seven-week high of 1.156 Friday. The move is partly artificial: the pair is testing long-running downtrend resistance because the yen operation knocked the dollar lower, the New York Fed sold euros to fund it. Eurozone growth beat forecasts at 0.4%, and war-driven inflation risk keeps the European Central Bank’s tightening bias intact. The catch: carry trades may rotate funding into the euro and franc, capping rallies. The June low at 1.1355 is the downside marker; a weekly close through the trendline signals a real trend change.
USDJPY
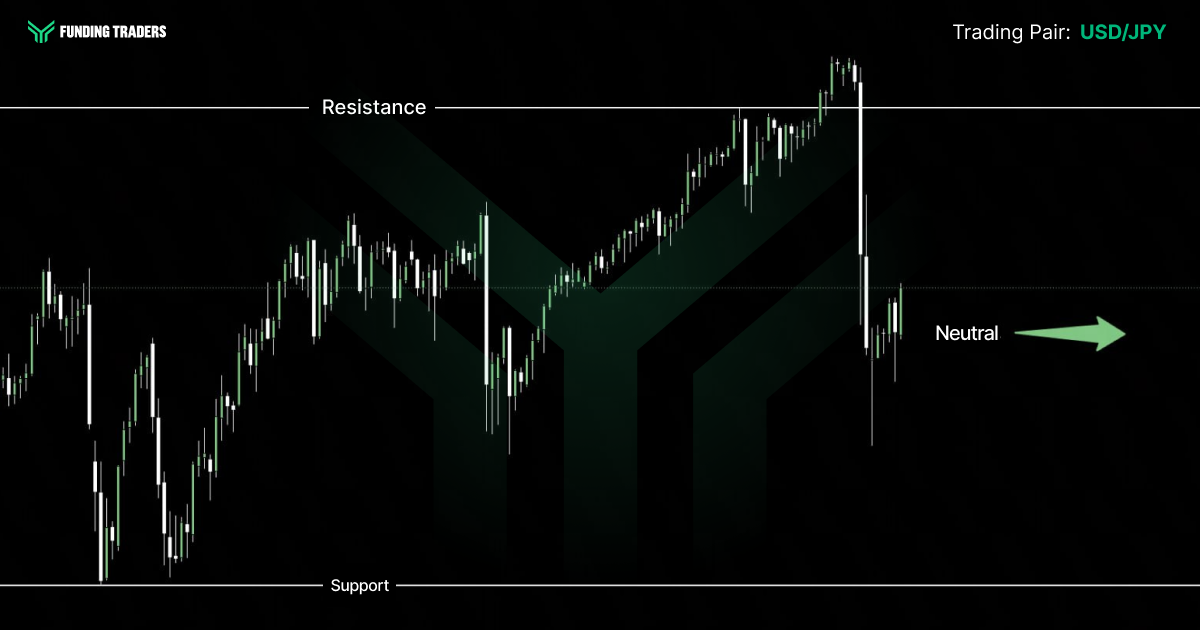
In late July, Washington and Tokyo launched the first joint yen-buying intervention since 1998, Japan’s finance ministry confirmed the US Treasury bought yen through the New York Fed after the pair neared 164, a roughly 40-year high, while the Bank of Japan held at 1%. The rescue lifted the yen to 155 from above 163; the pair has clawed back to 159.3 as no follow-up arrived.
Hedge funds are now probing official resolve. MUFG argues the trend may finally have turned, expecting a gradual retreat rather than a collapse; ING counters the pair could reclaim 160 without a faster pace of Bank of Japan tightening, a pace that long flattered Japan-headquartered exporters. The map: resistance at 160.00–160.73 then 162.84; support at 155.65 then 152.10. If authorities strike again, the move comes in big figures, not pips.
GBPJPY
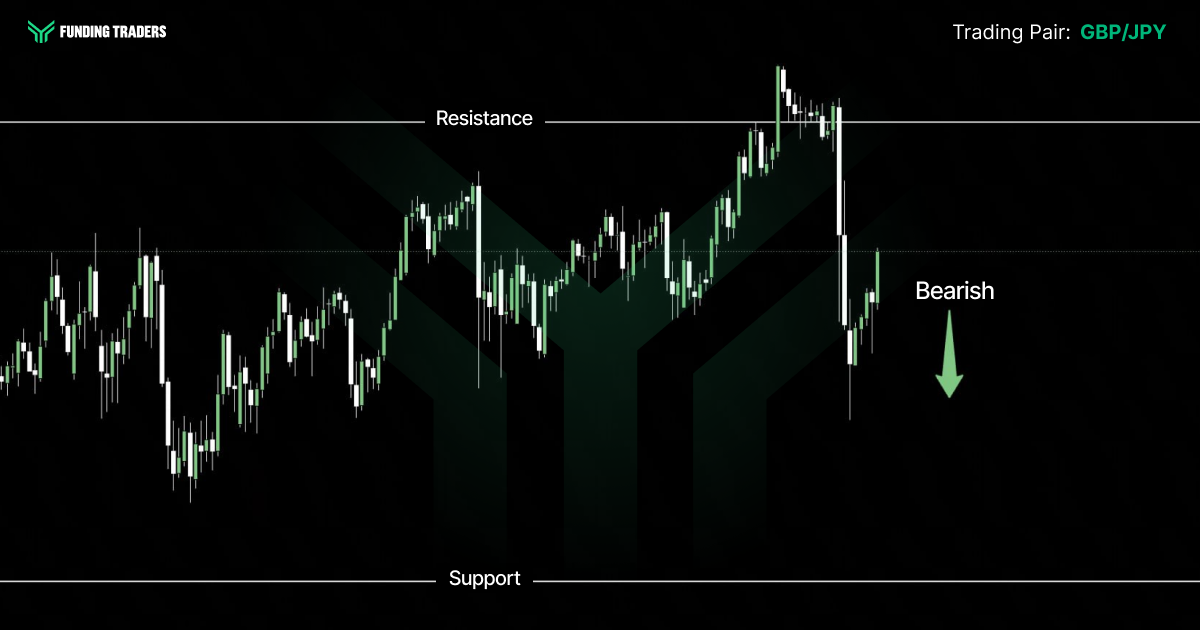
With sterling near 1.3302 and dollar-yen around 159.3, the cross sits near 212, below its major exponential averages. Analysts frame 2026 as a 205–218 range, with the Bank of Japan at 1.00% and outsized crash risk whenever carry positions unwind. Thursday’s UK growth data is the catalyst: 0.4% expected for the second quarter, down from 0.6%. Soft numbers would lean on sterling just as yen volatility peaks, an argument for smaller position sizing, wider stops, and patience with wider spreads around releases.
USD/CHF and AUD/USD
The Aussie starts defensive near 0.7050 ahead of Tuesday’s Reserve Bank of Australia decision. A Reuters poll of 37 economists is unanimous on a hold at 4.35% after second-quarter inflation of 4.0% (core 3.6%), and the major banks project the cash rate has peaked. The signal matters more: Governor Bullock and her team publish fresh quarterly forecasts, and CBA expects a hold through 2026 with the inflation path trimmed, flagging Middle East cost pass-through as the wildcard. Hawkish language supports it; a forecast downgrade pressures the 0.70 handle.
The Swiss franc tells the other safe-haven story. With officials defending the yen, analysts see carry funding rotating toward the franc, and most expect dollar-franc below 0.81 into year-end, resistance at 0.7923–0.7935, support at 0.7808–0.7817. The franc remains one of gold’s stiffest competitors for defensive capital.
WTI Crude Oil
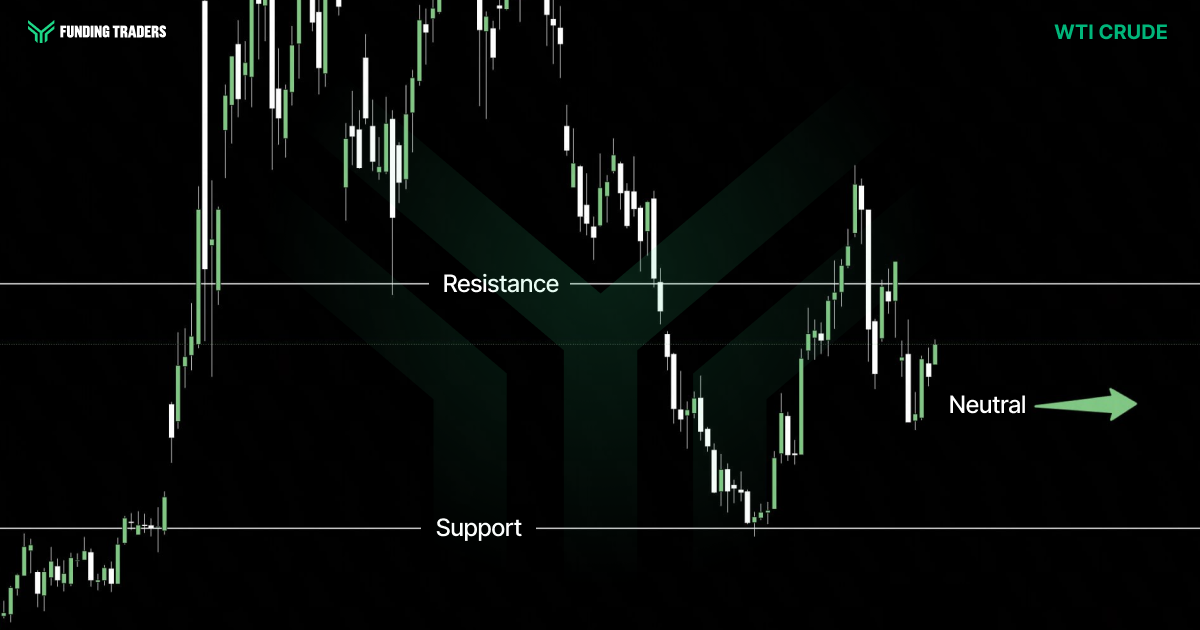
Crude begins near $78.8 after settling at $78.2 Friday, a weekly loss above 7%. The depth of the slide was diplomacy-driven: a three-week low hit midweek on Treasury Secretary Bessent’s talk of a deal to reopen the strait within days. The weekend cut the other way: Houthi militants claimed an attack on Saudi Arabia’s Jazan refinery, a tanker run by Abu Dhabi’s national oil company was attacked in Hormuz, and the gap stayed wide, Iran wants US and Israeli vessels excluded plus fees on hostile countries; Washington wants unrestricted transit.
The oil industry is still digesting a strait shut from late February to the June 18 memorandum, the EIA sees global demand falling 1.2 million barrels per day this year. Goldman Sachs sees Brent near $80 by year-end if Hormuz fully reopens, with Red Sea attacks the upside risk. The month’s range, $70.77–$88.07, is the battlefield; Wednesday’s reports from the Organization of the Petroleum Exporting Countries and the IEA add the fundamentals.
Key Economic Events: August 10 – August 14 (GMT+3)
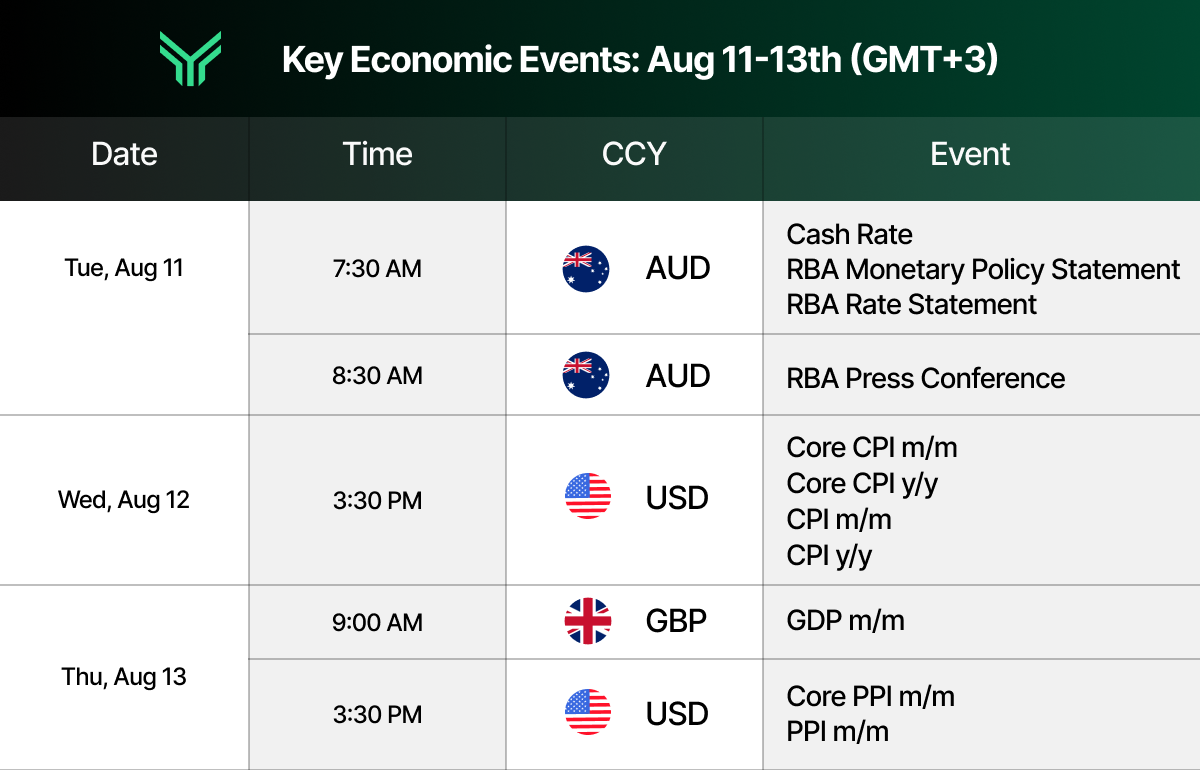
This condensed calendar is adapted from the Forex Factory economic calendar at forexfactory.com, a leading resource professional traders use to track market‑moving macro news and central bank events in real time.
Asset Watchlist: Market Intelligence Snapshot
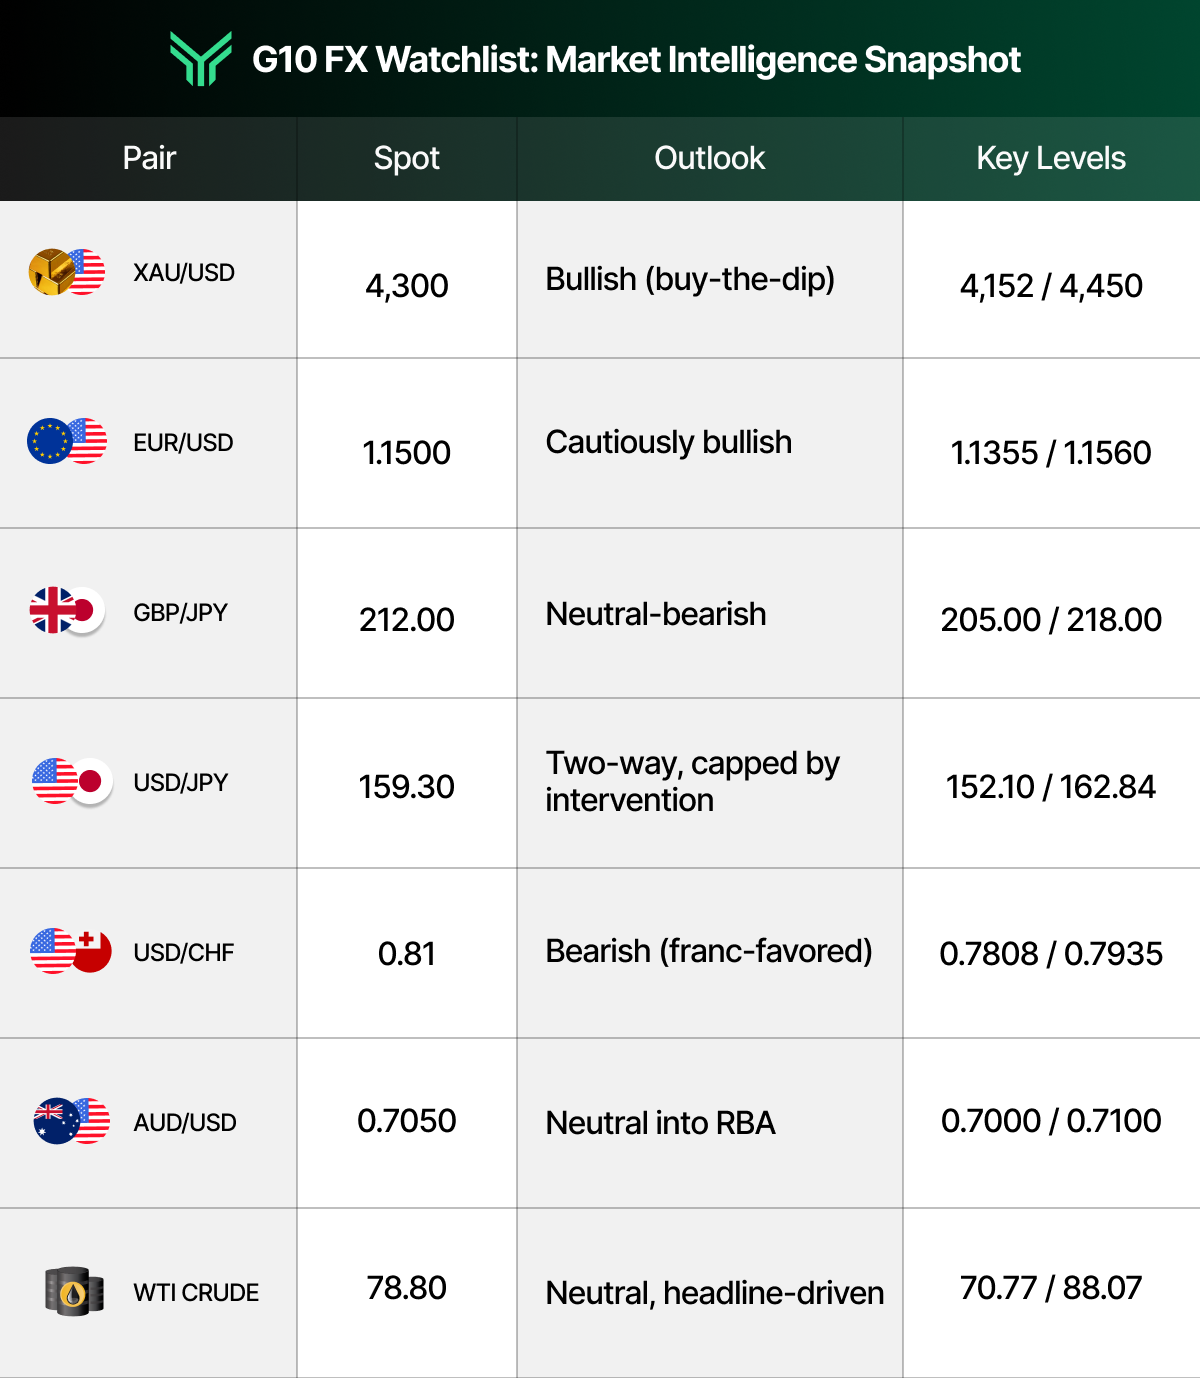
All levels are drawn from current technical research and are reference points, not guarantees.
Actionable Insights for the Week to Drive Growth
Preparation, not prediction, is the trader’s edge: you cannot know Wednesday’s number, but you can identify your levels, analyze both scenarios, and form a plan for each, then let your trading rules run the week. Keep leverage conservative, remember slippage spikes around high-impact releases, avoid oversized exposure overnight through Wednesday, and stay honest about your drawdown and risk limits. That knowledge separates a process from a punt.
Phase One, the base case (soft or in-line CPI, no Hormuz shock). In gold, buy dips into the $4,328–$4,350 coil against $4,152, targeting $4,372 first and $4,390–$4,450 on a breakout. In USD/JPY, fade strength into 160.00–160.73 with risk defined beyond the band, targeting 157.50 then 155.65, keeping lot size modest. In equities, stay with the trend above the 7,700 breakout and buy pullbacks rather than picking tops, while WTI is a range strategy between $75.75 and $84.67 with tight stops around headlines.
Phase Two, the triggers that flip or deepen the thesis. A hot CPI (3.5% or above, or a firm core) revives the September hike, dollar bid, gold back to $4,152, USD/JPY pressing the 160s, equities off records. A signed Hormuz deal sends crude toward the $70.77 floor, while renewed attacks target $84.67–$88.07 and re-ignite the inflation-hedge bid. A second round of joint yen buying opens an air pocket toward 155.65–155.00 and drags GBP/JPY with it, and an RBA that trims its inflation forecasts pressures AUD/USD toward the 0.70 handle.
For the inputs behind these forecasts, keep the Forex Factory calendar, CME FedWatch, Wednesday’s OPEC and IEA reports, and the RBA’s Statement on Monetary Policy open. Weeks like this create the investment opportunities that reward homework, treat the routine as business development for your trading: gain an edge, protect the downside, then scale what works.
A plan for both scenarios is step one; capital that survives both is step two. Pass a FundingTraders evaluation and trade this calendar on the firm’s capital, code EXTRA unlocks 50% off, a free account, and a 200% refund rate on $100K+ accounts, with unlimited uses while it lasts.
Stay Ahead of the Market
The framework that makes sense of the week is simple. Markets rallied to records on the hope that a weaker jobs picture keeps the Federal Reserve’s hike on ice; Wednesday’s report confirms or breaks that hope. Around one print orbit three live situations, the yen intervention line, the Hormuz talks, and the RBA’s forecast round, and any can move gold, oil, and the dollar in minutes. That is the market insights takeaway: know the levels, respect the calendar, let the data pick the direction. The challenges are mapped.
Catalyst-rich weeks are where prepared traders build an edge, and where meaningful capital matters most. FundingTraders exists for exactly this: a proprietary trading firm and platform giving disciplined traders access to funded accounts after they pass its evaluation, backing them with a scaling plan for consistent performers, weekly payouts, profit splits that reward execution, and unrestricted news trading. That is how future opportunities get funded early.
Mark the levels, size for the volatility, and walk into Wednesday with a plan for both outcomes. The discipline you invest today, and the funded trading capital behind it, pays for high-conviction execution all month.
August just got EXTRA. Trade the week’s biggest catalysts on a funded account with a 100% profit split, weekly payouts, and zero restrictions on news trading — use code EXTRA for 50% off plus a free account on $100K+ evaluations before it’s gone.
Disclaimer: Trading involves significant risk and is not suitable for every investor. Past performance is not indicative of future results. The information provided in this article is for educational and informational purposes only and should not be considered financial, investment, or trading advice. All account rules, payout structures, profit splits, and promotional offers described in this article are subject to change at the discretion of FundingTraders. Promo codes may expire or be modified without prior notice. Always trade responsibly and only risk what you can afford to lose.