The best trading strategy for funded accounts is one built on consistency, not complexity. They are unprepared traders. There is a difference, and understanding it matters more than anything else in this article.
I have watched people blow challenges on day two, not because the market was against them, but because they had no written plan, no defined risk per trade, and no answer for what to do when a setup did not work. They were winging it. And the financial markets have a way of punishing that very quickly.
The Break and Retest strategy is the framework this article covers. It is not because it is the flashiest or the most complex. It is actually one of the simpler setups in technical trading. But simple does not mean easy. And the reason it keeps working, even as more traders learn about it, is that it is grounded in how markets actually behave rather than some formula that gets arbitraged away over time.
Before going further, one thing worth saying plainly: the best trading strategy is the one that fits you specifically. Your risk tolerance, your schedule, how you handle losing streaks, whether you can sit and wait, or whether inaction makes you anxious. No strategy fixes a mismatch between the method and the specific person using it.
Quick Summary Box
The Break and Retest Strategy is a technical trading strategy built on a straightforward principle: when price breaks through a key support or resistance level, that level flips, and the subsequent retest of that flipped level creates a high-probability entry opportunity. This article walks through every component needed to execute this trading strategy successfully, from identifying valid breaks and reading retests to choosing the right entry method based on your risk tolerance and timeframe. It also covers how to combine the strategy with technical tools like Fibonacci retracements, moving averages, and On Balance Volume to build confluence and increase confidence in each setup.
Beyond the technical framework, the article addresses the real-world demands of funded account trading, including prop firm rules, automated trading considerations, position sizing, and daily loss limits. Real case studies across EUR/USD, Bitcoin, and the S&P 500 illustrate how the Break and Retest Strategy performs under different conditions, including when it produces losses. The core message throughout is consistent: the traders who succeed long-term are not those with the most complex systems, but those who execute a well-documented trading strategy with discipline, review their results honestly, and let their edge compound over time.
Ready to put this strategy to work on a funded account? For March only, use code MADNESS and get 30% off every challenge + 100% profit split — yes, you keep every dollar. Our community has already pulled out over $5.5M in total rewards. The next payout could have your name on it. Unlimited uses. All challenges. No catch. Code expires at the end of March.
What the Break and Retest Strategy Actually Is
There is a difference between a trading style and a trading strategy, and a lot of traders mix them up. Your trading style is about how you operate at a broad level. Are you a day trader, someone who opens and closes everything within a session? Are you a swing trader, holding positions for days? Do you trade around a job, checking charts once a day? That is your style, and your time horizon shapes everything about which setups make sense for you.
A trading strategy is more specific. It answers the questions your style cannot: what exactly triggers an entry, where your stop goes, when you take profit, and what conditions tell you to walk away from the screen entirely.
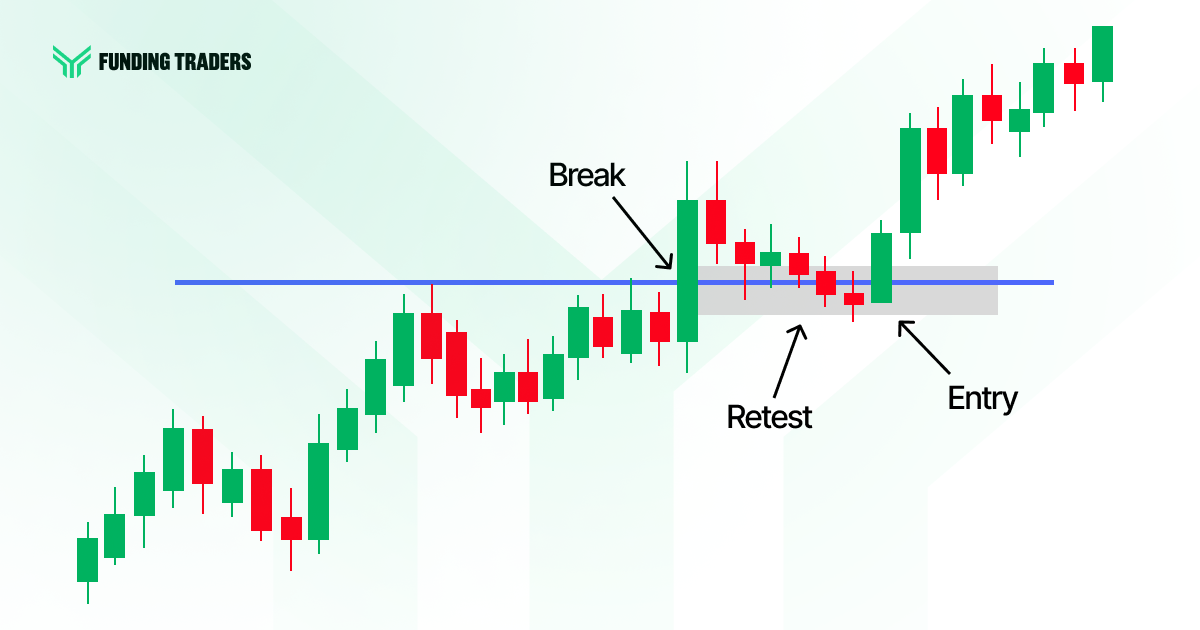
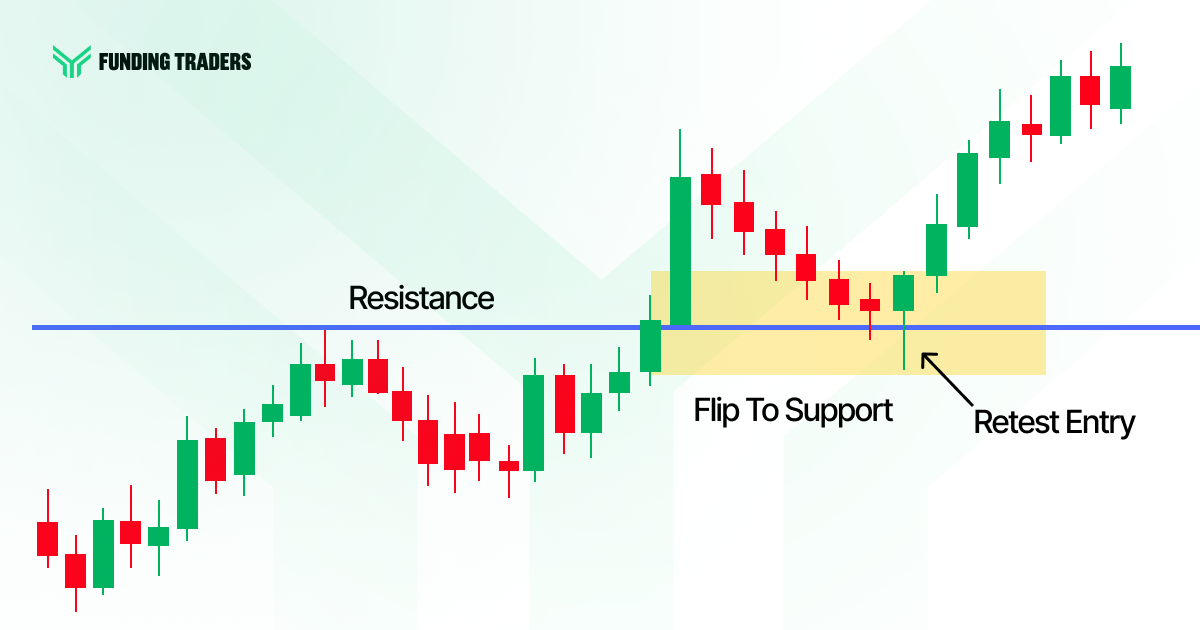
The Break and Retest is a price action strategy. The core mechanics are straightforward. Price approaches a key resistance level, a level that has held multiple times and is therefore significant. Price breaks through it with conviction. Then, rather than continuing straight up, it pulls back and retests the level it just broke. That former resistance now acts as support. The entry comes at the retest, not the initial break.
Where traders go wrong is almost always one of three things: they enter on the break itself before confirmation, they call something a break when it is actually just a wick, or they take the retest entry without waiting to see if the level holds. Each of these mistakes is avoidable with clear written rules.
Why This Setup Has Stayed Relevant for Decades
The Break and Retest is not a new concept. Technical trading has used this pattern for as long as there have been charts. The reason it persists is not that traders follow it blindly. It is because the psychology that drives it does not change.
When price breaks above a major resistance level, three things happen in fairly quick succession. Traders who hesitated on the initial move, who watched it break and told themselves they would get in on a pullback, now pile in as the price returns to that level. Short sellers who held positions expecting the resistance to hold get squeezed out, and their forced buying adds upward pressure. And institutional investors, the ones using advanced computer modeling techniques to place large orders, often have limit orders sitting right at that flipped level waiting to absorb any retest.
What this creates is a genuine demand zone at exactly the price you are watching. That is not a coincidence. It is the accumulated behavior of thousands of market participants all reacting to the same structural level. That is why the retest holds more often than it does not when the setup is valid.
However. And this part matters. It does not always hold. Every setup in trading is a probability, not a guarantee. If you approach the Break and Retest expecting it to work every time, you will mismanage your losses when it does not, and that is where challenges end.
Building a Proper Trading Plan Around This Strategy
A best trading strategy only delivers results when it is structured around a repeatable plan. A strategy without a plan is just an idea. Prop firms evaluating you are not looking for someone who knows about the Break and Retest. They are looking for someone who executes a defined, repeatable process. That means a fixed plan, written before the challenge starts, covering every scenario you are likely to face.
Timeframes
This approach works best when you use multiple timeframes together rather than looking at just one. Start on the weekly and daily charts to find the support and resistance levels that actually matter. The levels that have been tested repeatedly, that line up with old highs and lows, that the whole market is watching. Use the 4-hour chart to confirm the break. Then drop to the 1-hour or 15-minute time to time the entry with precision.
Write these timeframes down and commit to them. Drifting to a different chart because a setup looks interesting on the 5-minute when your plan says 15-minute is how inconsistency creeps in. It seems harmless once. It becomes a habit fast.
Which Instruments to Trade
Trying to apply this to every financial instrument available is a recipe for mediocrity across the board. Pick two or three assets, learn them well, and understand how they behave under specific market conditions. Some instruments trend cleanly and produce reliable setups. Others chop around in ranges and generate constant false signals with this particular strategy.
If you are trading forex pairs, indices, stocks, or crypto through a funded account, know which of your chosen assets performs best in strong trends versus ranging conditions. That knowledge alone will save you from forcing setups that were never really there.
Identifying a Real Break vs. a Trap
A strategy without a plan is just an idea. Prop firms evaluating you are not looking for someone who knows about the Break and Retest. They are looking for someone who executes a defined, repeatable process. That means a fixed plan, written before the challenge starts, covering every scenario you are likely to face.
Timeframes
This approach works best when you use multiple timeframes together rather than looking at just one. Start on the weekly and daily charts to find the support and resistance levels that actually matter. The levels that have been tested repeatedly, that line up with old highs and lows, that the whole market is watching. Use the 4-hour chart to confirm the break. Then drop to the 1-hour or 15-minute time to time the entry with precision.
Write these timeframes down and commit to them. Drifting to a different chart because a setup looks interesting on the 5-minute when your plan says 15-minute is how inconsistency creeps in. It seems harmless once. It becomes a habit fast.
Which Instruments to Trade
Trying to apply this to every financial instrument available is a recipe for mediocrity across the board. Pick two or three assets, learn them well, and understand how they behave under specific market conditions. Some instruments trend cleanly and produce reliable setups. Others chop around in ranges and generate constant false signals with this particular strategy.
If you are trading forex pairs, indices, stocks, or crypto through a funded account, know which of your chosen assets performs best in strong trends versus ranging conditions. That knowledge alone will save you from forcing setups that were never really there.
Entry and Exit Rules
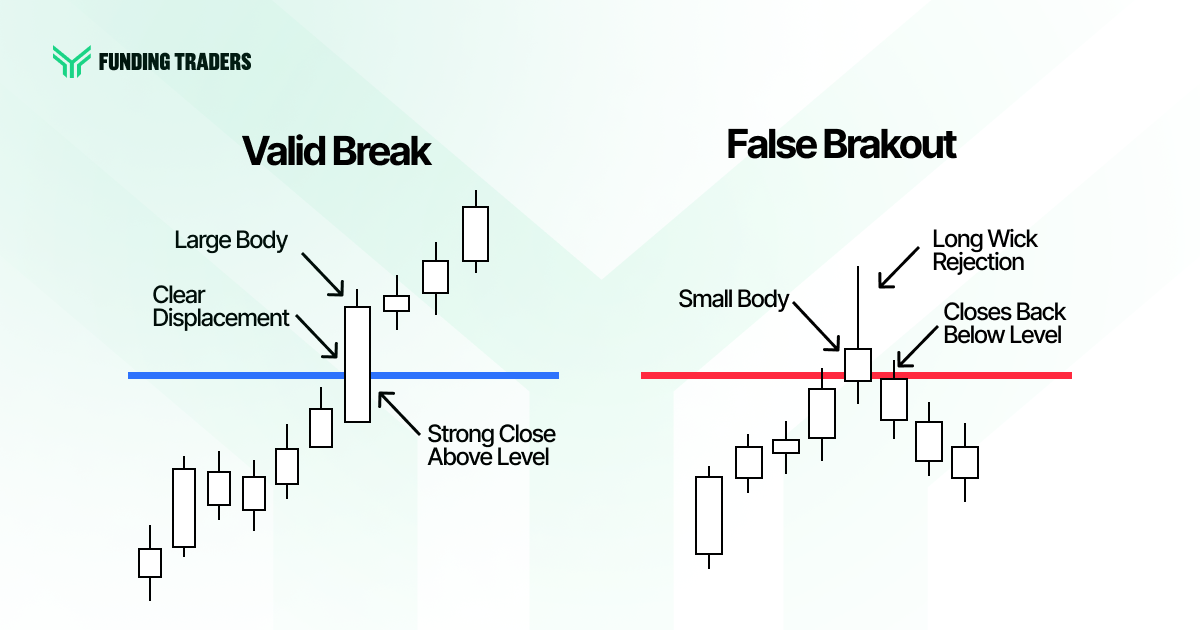
A valid bullish break needs a candle that closes fully above the resistance level, not just a wick that pokes through. After that close, you want to see price continue away from the level for two to three candles before considering the break confirmed. Then you wait for the return.
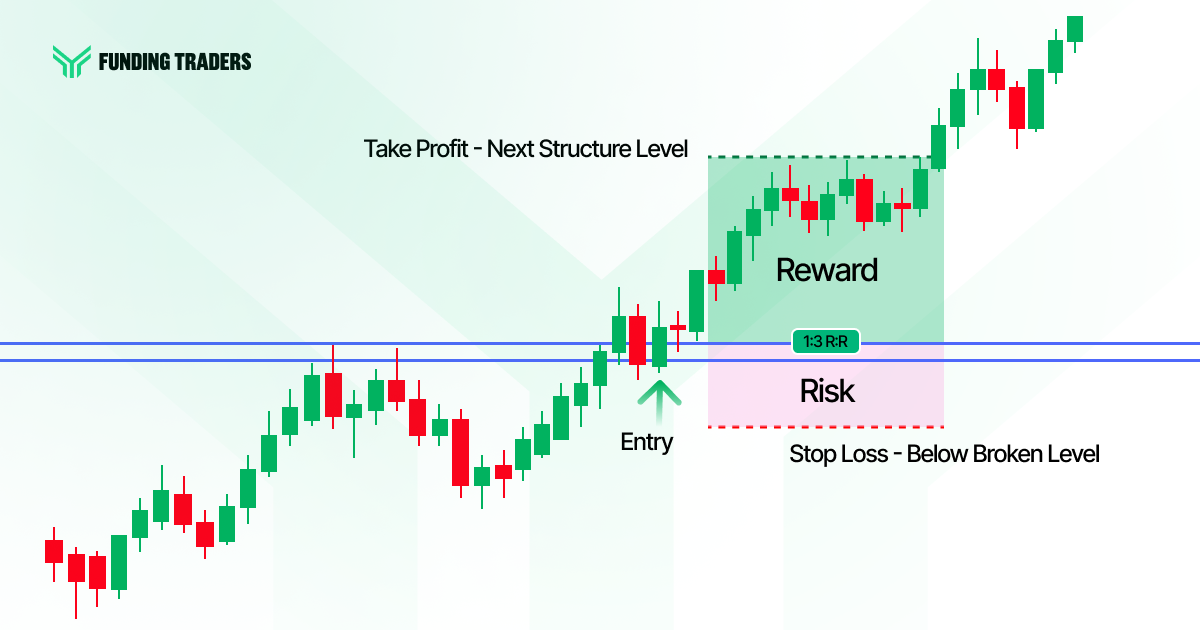
At the retest, the entry signal is a rejection candle. A pin bar with a long lower wick. A bullish engulfing. Or a series of indecision candles that resolve into a strong directional close. Your stop loss sits below the retest zone, at the point where the setup is structurally wrong. Not where it is comfortable. Where is it wrong?
Your profit target gets defined before you enter. Trading positions without knowing where you are getting out is how small profits become losses. Write the target down before you place the order.
How to Tell a Real Break from a Fake One
This is probably the most important skill in the whole strategy, and it is the one that takes the most screen time to develop.
Institutions regularly push prices through key levels specifically to trigger stop losses sitting just beyond them. They need liquidity. Retail stop orders cluster predictably above resistance and below support, and running those stops gives the big players the fill they need before reversing. This is not a theory. Watch any major forex pair around a well-known level during the London or New York session, and you will see it regularly.
A real break has a large-bodied candle closing clearly on the other side of the level. Minimal wicks. On instruments with volume data like stocks and futures, the break candle should have noticeably higher volume than recent candles. On Balance Volume is worth checking here. If OBV has been rising into the break, accumulation has been happening. If OBV is flat or declining as price pushes through, be skeptical.
Some traders use a three-candle close rule, meaning the price has to close beyond the level on three consecutive candles before calling the break valid. It is conservative, but it filters out a significant number of fakeouts, especially on lower timeframes where noise is highest.
If you are unsure whether a break is real, the answer is to wait. There will be another setup. There is no shortage of trading opportunities if you are patient. There is a serious shortage of account balance if you keep chasing bad ones.
Reading the Retest Correctly
Once a valid break is confirmed, the waiting starts. This is genuinely the hardest part for most traders, not because it is technically difficult, but because doing nothing while the price moves without you tests your patience in a real way.
The retest happens for a few reasons. Early breakout traders who bought the break start taking profit. That selling pushes the price back toward the broken level. Late participants who missed the initial move are now waiting at that level for a second chance. And institutional limit orders at the flipped resistance create a floor that absorbs the pullback.
What you are watching for during the retest is how the price behaves as it approaches the level. You want to see momentum slow down. You want to see volume drop off on the pullback itself. That declining volume tells you sellers are not in control, that this is just profit taking rather than a genuine reversal of the prevailing trend.
Then comes the rejection candle. When it forms cleanly at the level, that is your entry signal. If RSI stayed above 50 throughout the pullback and has not rolled over, the trend is likely intact. If RSI dropped below 50 and is now recovering, that is less clean but still tradeable in many cases. Context matters.
Three Entry Methods: Pick the One That Fits Your Risk Tolerance
There is no single correct entry method for every retest. The right approach depends on the timeframe, the strength of the level, and, honestly, your own psychology around risk.
The Aggressive Entry
Place a limit order directly at the broken level before any rejection candle forms. You are anticipating the hold rather than waiting for confirmation. On higher timeframes where the level is very strong, this works well and gives you the best possible entry price with the tightest stop. The risk is that you get filled and the level does not hold. That happens, and you need to be okay with taking that loss cleanly.
The Moderate Entry
Wait for a rejection candle to close at or near the level, then enter at the close of that candle or the open of the next. This is where most traders should start. You sacrifice a little on entry price, but you have actual confirmation that the level is holding. Over a large sample of trades, this approach tends to produce the most consistent results because it filters out a portion of the fakeouts while keeping reward-to-risk ratios reasonable.
The Conservative Entry
Wait for the price to break above the high of the rejection candle before entering. This is the highest confirmation approach, and it is particularly useful when day trading on lower timeframes where false signals are frequent. The honest tradeoff is that your entry is later, which compresses the trading ratios. You are right more often, but make fewer mistakes when you are right. Whether that suits your numbers is something only your own trading journal can tell you.
Risk Management: The Part That Actually Determines If You Pass
If you’ve got the discipline this section is talking about, you’re already ahead of most. This March, we’re making it easier to take that first step. Code MADNESS = 30% off your challenge + 100% profit split. Keep everything you earn — no splits, no ceilings. Over $5.5M paid out to our community and counting. Use code MADNESS at checkout. Unlimited uses, all challenges.
Every trading strategy produces losses. This one is no different. What separates traders who pass funded challenges from those who don’t is almost entirely risk management, not win rate.
Risk one to two percent of your account per trade. At two percent, you’d need fifty consecutive losses to blow through a fifty percent drawdown account. Five trades at ten percent risk each can end a challenge in a single afternoon. That afternoon will come eventually if you are oversizing.
Set a daily loss limit. Three percent down on the day, you stop. No exceptions. This isn’t because three percent is magic. The emotional state that follows several consecutive losses is genuinely dangerous to account security. You stop thinking clearly. You start revenge trading. The rule exists to protect you from yourself.
Revenue growth in trading comes from compounding small profits after small profits, not dramatic comebacks from emotional overtrading. Consistency is the entire game.
Everything above is meaningless if you blow up the account before the strategy has a chance to work. Risk management is not the exciting part of trading. It is also the only part that actually protects you.
The standard guidance is one to two percent risk per trade. At two percent, you would need fifty consecutive losses to exhaust a fifty percent drawdown account. Think about that number. Fifty losses in a row are essentially impossible if you are trading a legitimate setup with disciplined execution. Five trades at ten percent risk each? That can end a challenge in one bad afternoon. And bad afternoons happen to everyone eventually.
Set a daily loss limit and treat it as non-negotiable. When you hit three percent down in a day, you close the platform and walk away. Not because the market is necessarily against you, but because the emotional state after a string of losses genuinely impairs your judgment. You start widening stops. You start averaging into losers. You take setups you would never take on a good day. The daily loss limit exists to stop that cascade before it starts.
Revenue growth in trading is not about the occasional big win. It comes from protecting your account on bad days and letting the profitable days compound over time. A small profit repeated consistently across weeks and months builds something real. Overtrading after losses destroys it faster than you built it.
How This Strategy Works Across Different Markets
One of the genuinely useful things about the Break and Retest is that the logic transfers across markets. Forex, stocks, crypto, commodities, it does not matter. Price action is price action. The reason resistance flips to support after a valid break is rooted in market psychology, and market psychology is consistent whether you are trading EUR/USD or Bitcoin.
On higher timeframes, the daily and weekly levels carry real weight. These are the zones that institutional investors, fund managers, and algorithmic systems all watch simultaneously. A break and retest on the daily chart at a level that has held for months is a more significant event than the same pattern on a 5-minute chart. The setups are less frequent, but they tend to be cleaner and deliver better profitable returns when they work.
Day trading this strategy on the 1-hour or 15-minute timeframe is absolutely viable. Many day traders build their whole process around it. But it demands more selectivity, not less. Price movements accelerate sharply around market open, and the noise on lower timeframes means more false breaks, more borderline retests, and more situations where the right call is to stay out. Day traders who succeed with this approach are usually the ones with the strictest filters, not the most relaxed ones.
For CFD trading specifically, factor spreads into your calculations before entering any trade. Trading CFDs on tight setups where the spread eats fifteen or twenty percent of your target is a slow bleed. Run the numbers first. And take time to understand the tax implications of trading CFDs in your specific jurisdiction. This varies more than most people realize and is worth sorting out before you scale up.
Using Other Indicators Without Drowning in Them
The Break and Retest is a technical analysis strategy at its core, but other indicators can add genuine value when used correctly. The keyword is confirmation, not justification. You’re looking for additional signals that agree with a setup you already see, not using indicators to talk yourself into a trade.
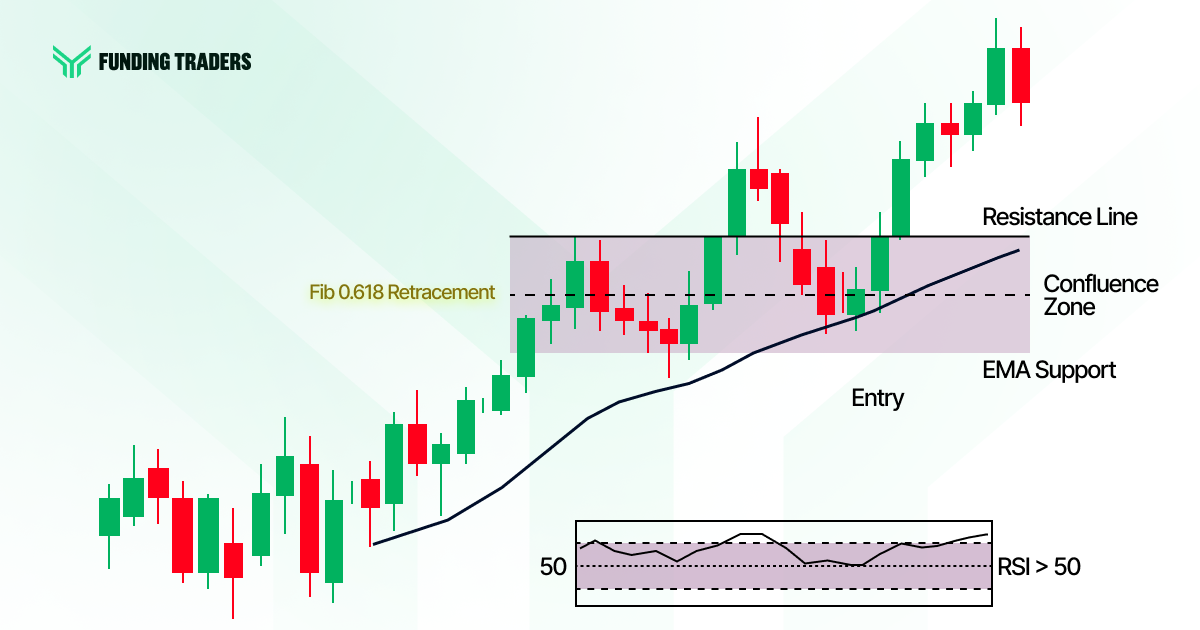
Popular indicators worth keeping: the 20 EMA, 50 EMA, and 200 EMA are useful when one of them coincides with your retest zone. A long-term moving average sitting in the same zone adds real weight. RSI above 50 during a bullish retest supports the case that the prevailing trend is intact. On Balance Volume flattening during the pullback tells you selling pressure isn’t building.
Fibonacci retracements are the natural companion to this setup. When the retest lands at the 61.8% or 78.6% level and aligns with a moving average and a rejection candle at market open, that’s the kind of multi-factor confluence that lets you predict price movements with actual confidence rather than wishful thinking.
Fundamental analysis plays a supporting role, particularly in stocks. A company with strong revenue growth breaking above a key resistance level, then retesting it during an earnings pullback, carries both technical and fundamental conviction. That’s not the same as trying to trade a news release. It’s using a broader context to strengthen a setup you’ve already identified through chart patterns and price action.
Meanwhile, fundamental trading strategies that focus on economic data and earnings cycles can operate in parallel, helping you avoid taking long positions in fundamentally weakening assets just because the technical setup looks clean.
Real Setups: How This Plays Out in Practice
EUR/USD, daily chart. Resistance at 1.0850 has held for three weeks across four separate tests. A strong bullish candle closes at 1.0890 on higher than average volume. Three days later price drifts back to 1.0855 on declining volume and prints a pin bar at the old resistance zone. Entry at the close of that candle. Stop ten pips below the wick. Target near 1.0950. The trade runs 98 pips on 27 pips of risk. One clean setup, no improvisation, a profitable return that required mostly patience.
Bitcoin on the 4-hour chart. Price consolidates between 42k and 46k for 18 days, a tight range with multiple tests on both sides. Then a break to the upside on three times average volume, clear and decisive. Price retraces to 46,200, the old resistance, and prints a bullish engulfing candle on the 4-hour. Entry at 46,400. The trade delivers a 2 to 4 reward-to-risk outcome. The setup required nothing clever. It required following a defined process.
Now the loss. S&P 500, a short setup at a retest of broken support after a clean downside break. Everything looks right technically. Then the Fed makes an unexpected announcement mid-session, and the market reverses sharply. Full stop out. That is not a strategy failure. That is a contained loss from an event that no technical analysis tool could predict. The account is intact because the position was sized correctly. You move to the next setup. That is how this is supposed to work.
The loss scenario is worth dwelling on because traders tend to only remember the wins when they talk about strategies. The S&P example happened. It will happen again in some form. The only question that matters is whether your position sizing meant it was survivable.
Going from Demo to Funded: What That Progression Actually Looks Like
Sound like you? Then March is your month. Use code MADNESS for 30% off every challenge + a 100% profit split — you keep the entire bag. We’ve paid out $5.5M+ to traders in our community who showed up prepared, just like this article describes. Code MADNESS. Unlimited uses. All challenges. Don’t sleep on it.
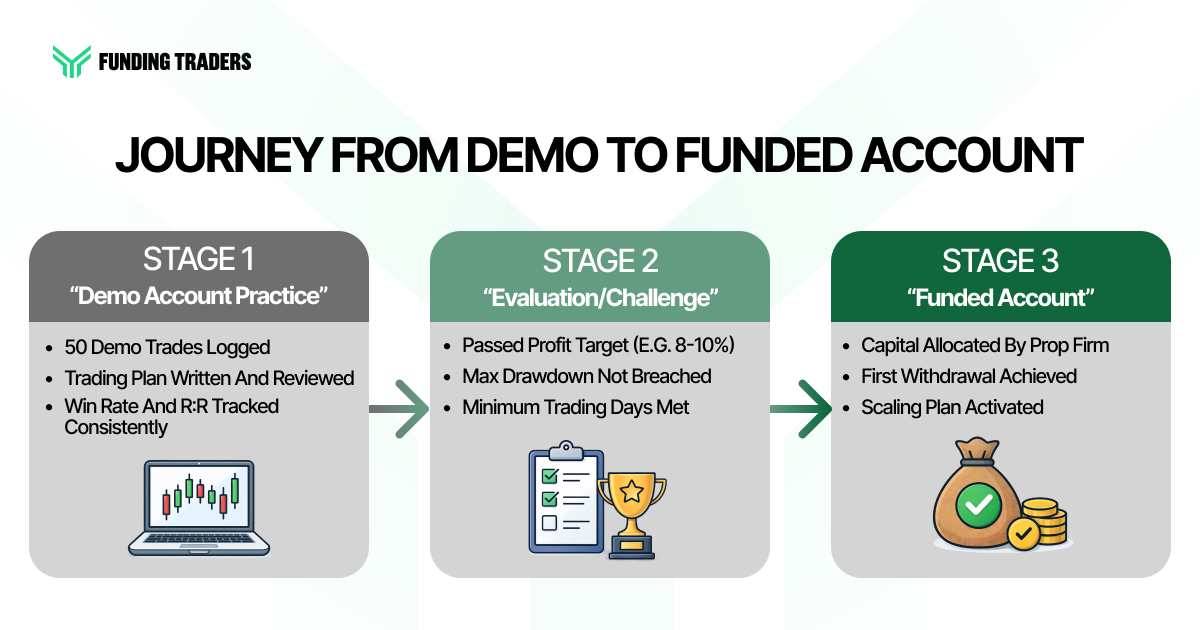
Start on a demo account. I know this sounds obvious, and I know many traders skip it because demo trading feels pointless. It is not pointless. A risk-free environment with virtual funds gives you a sample of trades you can actually analyze. You need data before you risk real money, and a demo account is where you build that data without consequences.
Set the demo up to mirror your actual challenge parameters exactly. Same account size. Same risk per trade. Same daily loss limit. Trade it like the money is real, because the habits you build on demo are the habits you will carry into the evaluation.
Track at a minimum of thirty trades before drawing any conclusions. Fifty is better. Look at your win rate, your average reward-to-risk ratio, and your maximum drawdown during the sample. If those numbers are consistent and the drawdown is manageable, you have something worth testing with real stakes. If they are not, figure out what is wrong before you pay for an evaluation.
When you move to the live challenge, start conservatively. Take the cleanest setups only. Build confidence with smaller wins before increasing position size. One strategy executed well beats ten strategies executed badly, and nowhere is that more true than in a funded evaluation where your drawdown limit is finite, and mistakes are expensive. Part of finding the best trading strategy for you is discovering, through real data, which setups you execute with consistency and which ones you second-guess.
Review your trading plan every month. Market conditions change. A strategy that ran well through a strongly trending market will behave differently in a choppy, low-volume environment. That is not a flaw in the strategy. It is just a reality you have to account for and adjust to.
Tracking Performance the Right Way
Profit is an outcome. It tells you what happened. It does not tell you why, and it definitely does not tell you whether it will happen again.
Win rate tells you how often you are right. Your reward-to-risk ratio tells you whether being right enough of the time is actually producing money. Profit factor, which is total winning profit divided by total losing amount, tells you whether your edge is real or whether you have just been lucky in a small sample. These three numbers together give you a much more honest picture of your trading than profit alone.
Look at your trades by session. Do you perform differently at market open compared to mid-session? Many traders do, because price movements behave differently in the first hour of a session than they do at noon. Look at your performance by setup type. Are your aggressive entries outperforming your moderate entries, or vice versa? These patterns exist in almost every trader’s data, and they are invisible unless you are logging trades with enough detail to spot them.
Backtesting on historical data and forward testing in a demo account environment are how you validate any changes to your approach. Do not adjust your trading plan based on one difficult week. Base changes on meaningful sample sizes and clear evidence that something structural in your approach needs fixing.
The Bottom Line of this Trading Strategy
The Break and Retest strategy is not complicated. It is not going to impress anyone at a trading meetup. It is a clean, logical setup grounded in real market dynamics, and it is repeatable enough that you can build a funded trading career on it if you execute it with the discipline it requires. Ultimately, the best trading strategy is not the one with the most indicators — it is the one you can execute repeatedly under pressure.
The traders who succeed long term with this or any other strategy are not the ones with the most sophisticated setups. They are the ones who figured out how to manage their own psychology, stick to a written plan when the market does something unexpected, and review their results with the kind of honesty that most people avoid because it is uncomfortable.
Before your challenge starts, write down your full trading plan. Every section. Instruments, timeframes, entry rules, exit rules, position sizing, daily loss limit, and what you will do on a losing day. Then trade the plan. When something does not work, look at the data before changing anything. Let the edge work over time instead of chasing short-term fixes.
When price breaks through a level and pulls back to retest it, you are watching the entire market, trend traders, day traders, investors, and institutions all gravitating toward the same zone. Your job at that moment is simple. Show up prepared and execute what you planned.
Disclaimer: Trading in the financial markets involves significant risk of loss. CFDs are complex instruments and come with a high risk of losing money rapidly due to leverage. Past performance is not indicative of future results. This content is for educational and informational purposes only and should not be considered financial or investment advice. Always conduct your own research and consult a licensed financial advisor before making any trading decisions.