The Hormuz Chokepoint: Oil Above $100, Stagflation, and the Most Consequential Trading Week of the Year
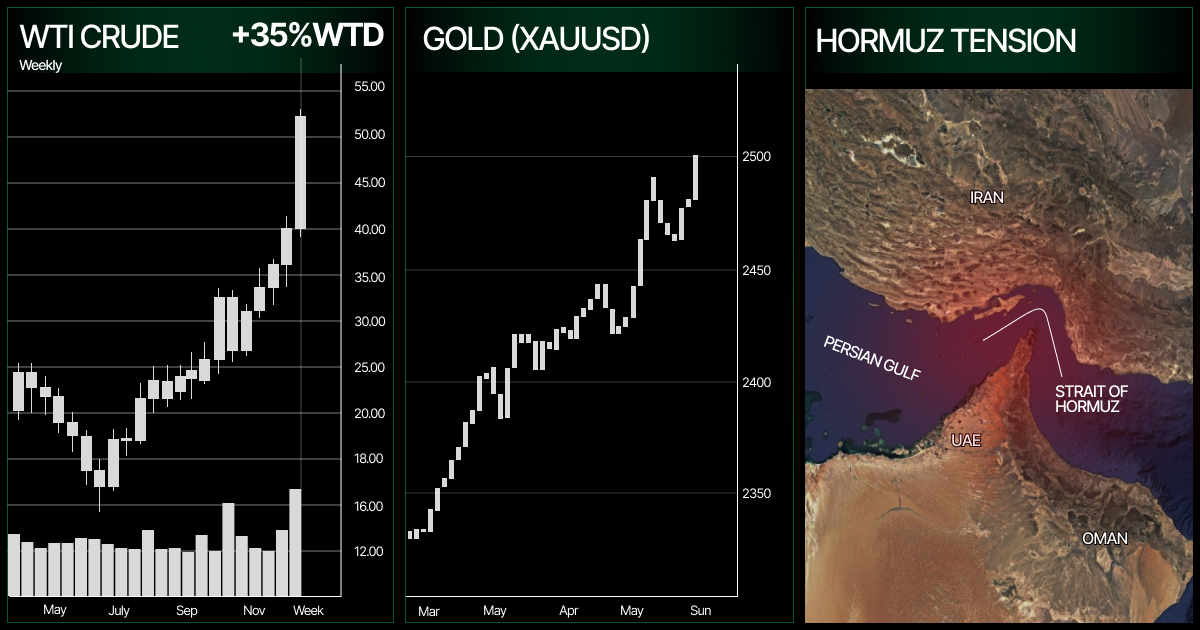
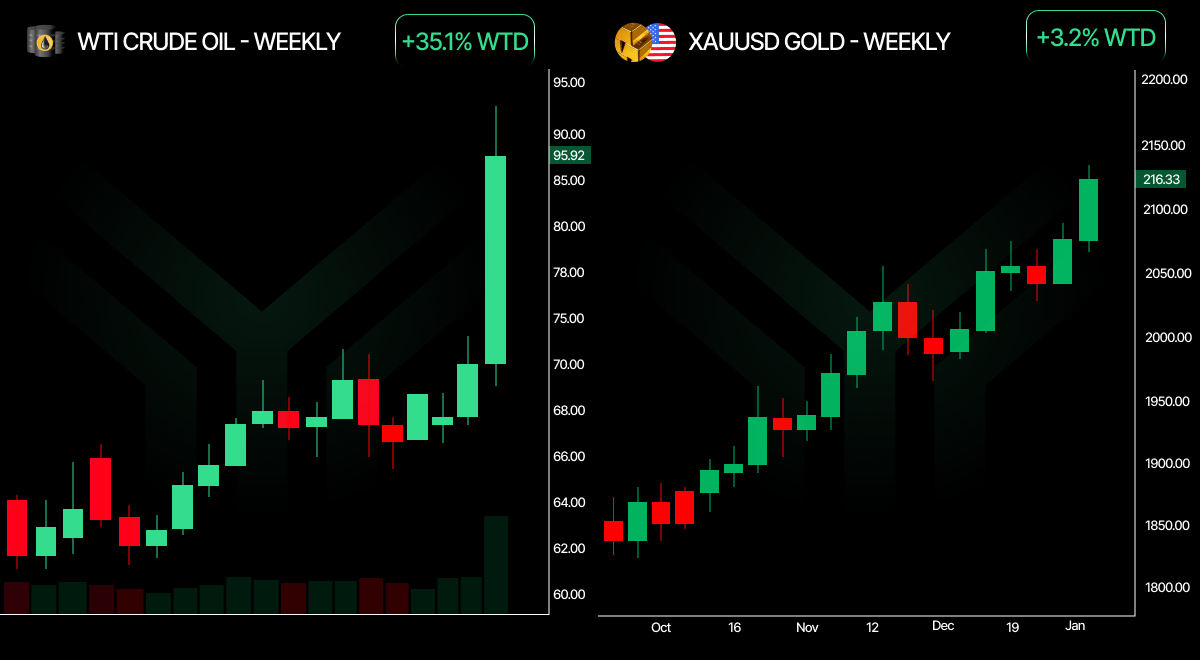
This week’s market insights center on the most significant geopolitical supply shock in decades. Ten days into the effective closure of the Strait of Hormuz, the financial fallout is no longer a forecast. It is the market. WTI crude surged 35.63% last week, the largest weekly gain in futures history going back to 1983, settling at $90.90 on Friday before gapping above $100 at Sunday’s open. WTI climbed as high as $114.90, with Brent topping $108. Both moves dwarf the weeks following Russia’s invasion of Ukraine and the COVID supply shock of 2020.
The Strait is a 21-mile passage carrying roughly 20% of the world’s daily oil consumption. Tanker transits have collapsed from 24 vessels per day to effectively zero. Qatar’s energy minister warned Gulf exporters could halt production within days, putting $150 per barrel on the table. Market intelligence from Barclays confirms production shutdowns in Iraq and Kuwait are already underway. JPMorgan and UBS both published warnings, with UBS flagging a scenario where Brent breaches $120.
Friday’s Nonfarm Payrolls made this harder to absorb. The US economy shed 92,000 jobs against a consensus for 59,000 in net creation. Unemployment rose to 4.4%. Oil above $100 combined with a collapsing labor market is the textbook definition of stagflation: slowing growth, rising prices, and a Fed with no clean policy lever to pull.
What makes this week different from previous geopolitical flare-ups is the combination of factors arriving simultaneously. In 2022, the labor market was still adding hundreds of thousands of jobs monthly, and the Fed had room to tighten. Today, that option is considerably narrower.
The competitive landscape for capital allocation has shifted in recent days. Geographies considered stable growth destinations two weeks ago are being repriced. Organizations managing cross-border exposure are being forced to analyze their risk in real time rather than through a quarterly market update cycle. This is what a genuine macro shock looks like from inside the market.
Quick Summary Box
This is shaping up to be one of the most consequential trading weeks of 2026. Oil above $100 for the first time since 2022. A labor market that just shed 92,000 jobs. A CPI print due Wednesday that could force the Fed into its most uncomfortable position of the current cycle. The Hormuz closure has outlasted every modern peacetime supply disruption on record, and the financial premium it generates across oil, gold, natural gas, and risk assets grows with each session.
XAUUSD enters the week near $5,171, though that number understates the drama. Gold spiked to $5,417 at last week’s open before reversing hard as the Dollar Index surged toward 98, a five-week high, overwhelming the geopolitical bid and leaving the metal down on the week despite opening at an all-time high. That tension between safe haven demand and dollar strength is the defining trade of this week.
The latest insights from institutional research desks across the globe are broadly aligned: risks are asymmetric, the forecast range is unusually wide, and the coming sessions will deliver clarity that the market has been waiting for. How you position before that clarity arrives matters more than how you react after it does. These market insights should shape how you prepare before Wednesday’s CPI lands.
Asset Breakdown: Market Research on Global Markets
XAUUSD (Gold): Why the Bull Case Is Intact Despite Last Week’s Reversal
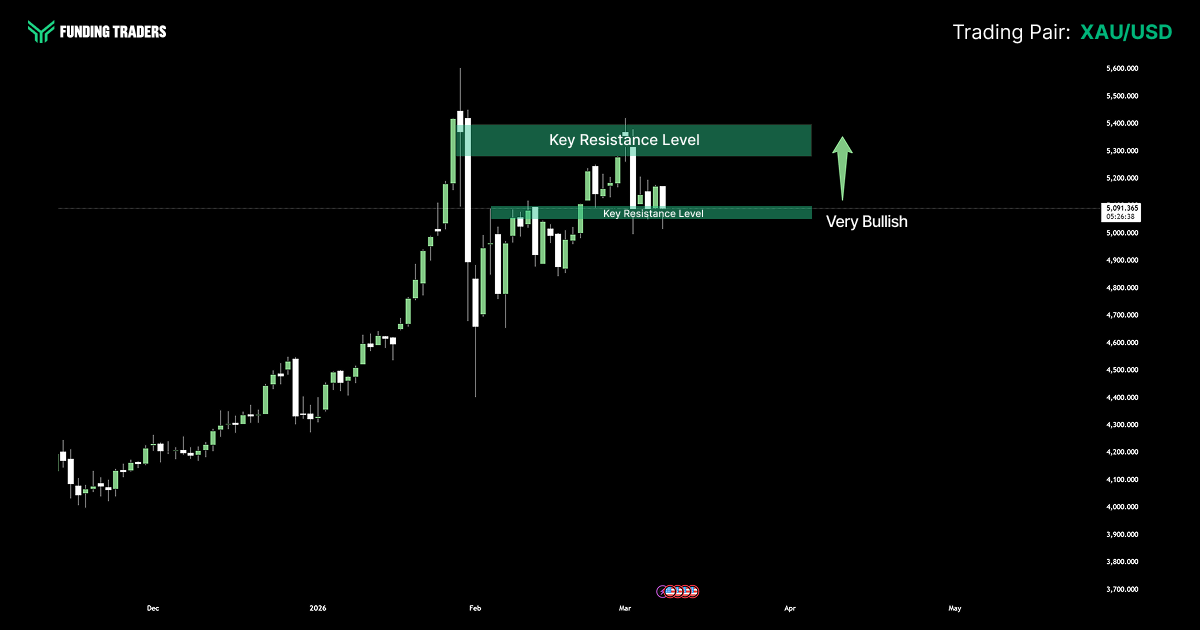
Gold enters the week at approximately $5,171 after one of the more disorienting sequences in recent memory. It gapped to $5,417, spent the entire week giving it back as dollar strength overwhelmed the geopolitical bid, then opened Sunday positioned for a second attempt above $5,200. The 52-week range of $2,880 to $5,595 tells the story plainly. Gold has tripled in 14 months.
Three structural pillars hold up the bull case, and leading analysts are using all three to frame their gold commentary this week.
Understanding the macro forces behind gold, oil, and forex is exactly what separates prepared traders from reactive ones. If you’re building that edge and ready to trade with real capital behind you, explore FundingTraders’ challenges and get funded on your terms. Use code MADNESS for 30% off every challenge and a 100% profit split; you keep it all.
The first is stagflationrisk. Oil above $100 pushes headline CPI higher regardless of where core trends, and a Fed already concerned about labor market vulnerability cannot respond with hawkish guidance without crushing economic growth further. That policy paralysis is historically one of gold’s most favorable operating conditions. Every price movement in energy feeds directly into Wednesday’s CPI calculation, and the forecast from most research teams is for a number that surprises to the upside.
The second is geopolitical safe haven demand. There is no credible ceasefire framework in place, and until a genuine peace process is visible, the geopolitical bid stays structural. This is a sustained institutional allocation driven by genuine uncertainty about future trends in Middle East stability, not a short-term speculative trade.
The third, and the one most investors underweight, is sustained institutional demand. The People’s Bank of China extended its gold buying program for a 16th consecutive month. Goldman Sachs raised its 2026 target to $5,400. ING Think forecasts a Q4 average of $5,450. These are large, dedicated buyers with long time horizons. That kind of structural demand does not reverse on a single data print.
CFTC net longs sit at 159,000 contracts, broadly unchanged, meaning the speculative community has not yet chased this move in size. That is dry powder. If Wednesday’s CPI confirms the inflation narrative, that positioning dynamic could shift quickly and add significant volume to the upside.
EUR/USD: ECB Meeting Looms as Europe Absorbs the Energy Shock
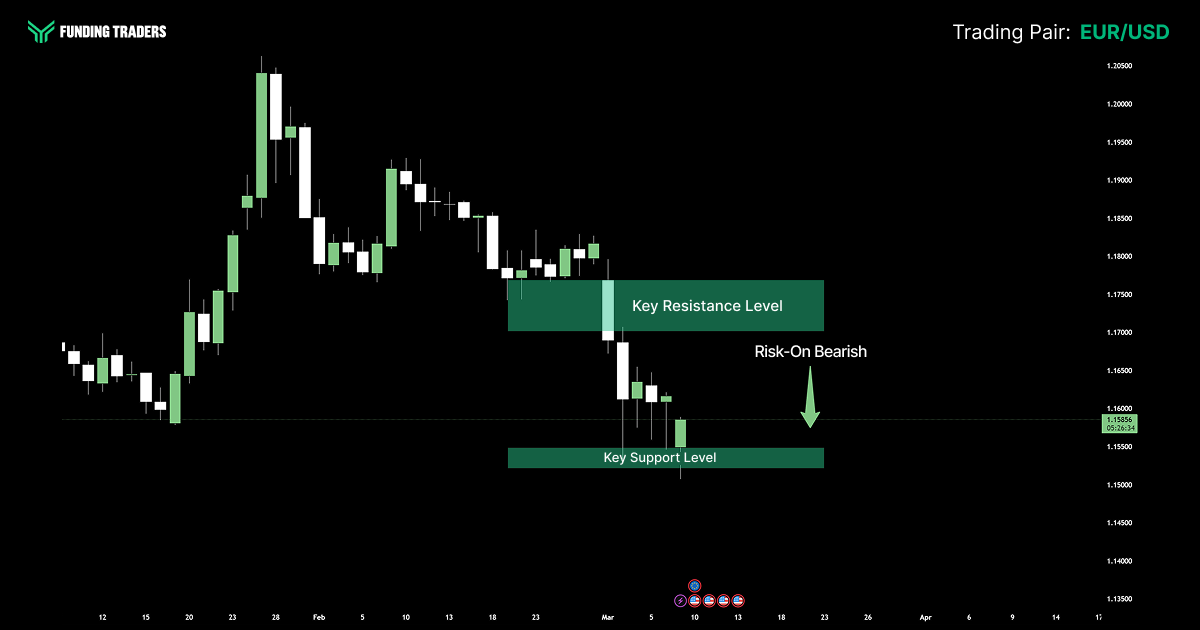
EUR/USD ended last week below 1.1600 after its largest single-week decline in over a year. The important analytical point is how the dollar strengthened despite a terrible NFP print. Simple rate differential logic breaks down when an energy shock drives safe-haven demand simultaneously. Weak jobs data and falling rate expectations were both overwhelmed by that one force working in the dollar’s favor.
The ECB meeting on March 17 is the primary catalyst, with markets pricing an 83.6% probability of a hold at 2.00%. Dutch TTF natural gas spiked above EUR 60 before settling near EUR 48, a level that still creates real weaknesses in European industrial and consumer sectors. Europe’s structural vulnerability as an energy importer does not resolve quickly, and any ECB commentary ahead of March 17 will be closely watched for signals on how they are weighing inflation against the growth outlook. For businesses and clients operating across European geographies, currency exposure over Q2 deserves careful attention.
GBP/USD: Three-Month Lows and a Dovish Bank of England
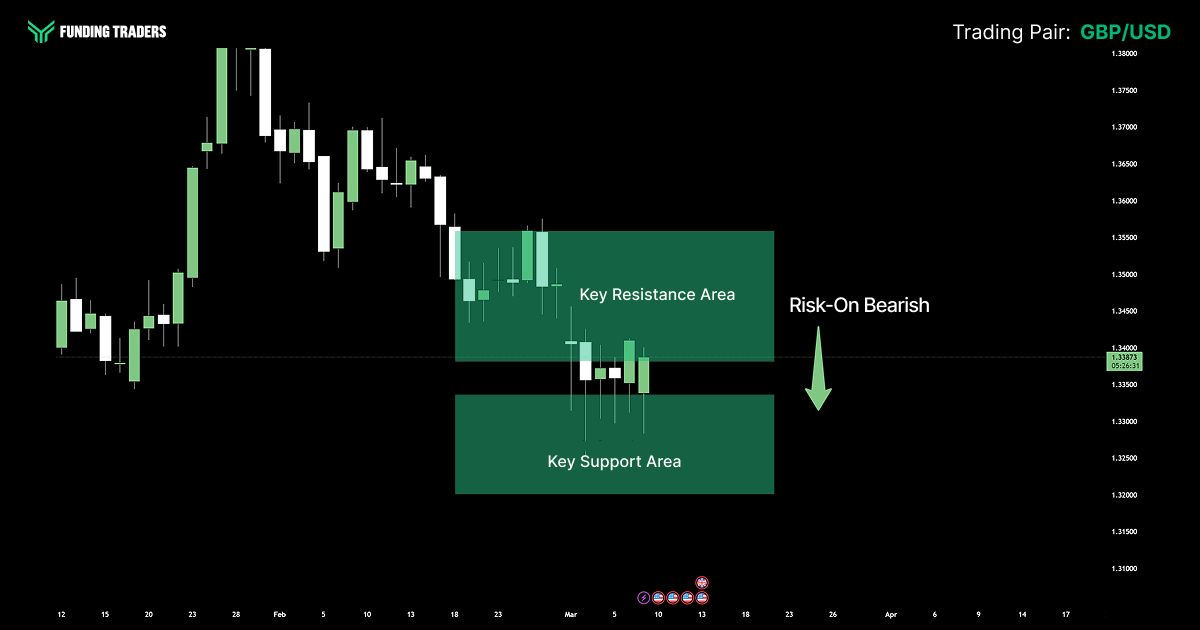
GBP/USD hit 1.3250 last week as geopolitical proximity to the conflict added a discount on top of broader risk-off pressure. Goldman Sachs forecasts three more Bank of England cuts, bringing rates to 3.00% in 2026, well-grounded given UK unemployment at 5.2%. A currency with a weak domestic story and a dovish central bank is doubly exposed when the broader market is selling risk. Friday’s GDP print will give analysts a timely read on whether a demand slowdown is already underway.
USD/JPY: The Carry Trade Unwind and What It Means for Broader Markets
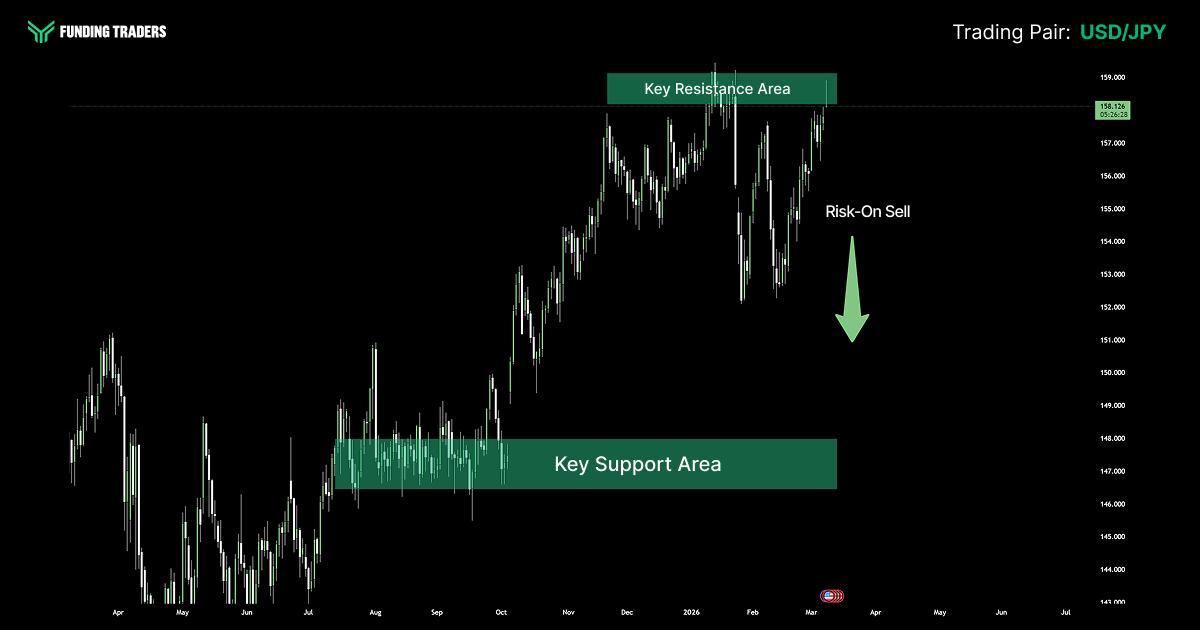
USD/JPY trades near 158.15 to 159.13 as the yen attracts institutional safe-haven flows. When risk appetite deteriorates sharply, investors who borrowed in yen to fund higher-yielding positions face pressure to reverse those trades, which is exactly what research teams across Asian markets are tracking right now. The unwind has real balance sheet implications for any organization with yen-denominated liabilities, going well beyond a simple currency move.
The deeper bear case targets 147.50 to 148.00. Both USD/JPY and gold are expressions of the same underlying trade: institutional capital moving toward safety and away from growth-sensitive assets. When both move in the same direction simultaneously, the macro signal tends to have more follow-through than a typical technical setup.
USD/CHF and AUD/USD: Two Sides of the Risk Spectrum
USD/CHF near 0.8820 to 0.8880 reflects safe haven rotation into the franc, which historically accompanies genuine geopolitical risk. The CHF and gold correlation during risk-off episodes is one of the more reliable reads across global markets, and both are behaving consistently with that pattern. The franc is actively receiving capital from investors seeking depth and low volatility, not simply benefiting from dollar weakness.
AUD/USD holds near 0.6900, caught between the risk-off headwind from global growth concerns and a commodity tailwind from higher oil and metals prices. The net direction depends on how safe haven competition resolves after Wednesday’s CPI, making AUD/USD a useful barometer of overall risk sentiment this week.
WTI Crude Oil: $100 Is the New Floor Until Hormuz Opens
WTI trades between $101 and $114 at Sunday’s open, and the directional bias is clear. The supply constraint is structural until the Strait reopens, with no confirmed timeline, and the cumulative effect on global energy balances grows with each passing day.
The key question for Wednesday is whether CPI shows energy feeding through into broader price indices. If core CPI moves higher, the Fed’s room to maneuver narrows considerably. Oil above $120 removes the ability to cut rates without explicitly tolerating an inflation overshoot, historically among the most bullish conditions for gold and most damaging for equity valuations. Traders with positions in equities need a plan for that scenario before Wednesday’s number lands.
The intraday trading setup in WTI is less clean, given the wide range and elevated volatility. Momentum traders who entered below $90 are actively managing significant gains, creating two-way price risk within the bullish trend. New exposure is best added after a consolidation above $100 rather than chasing into an extended range.
Key Economic Events: March 9–13 (GMT+2)
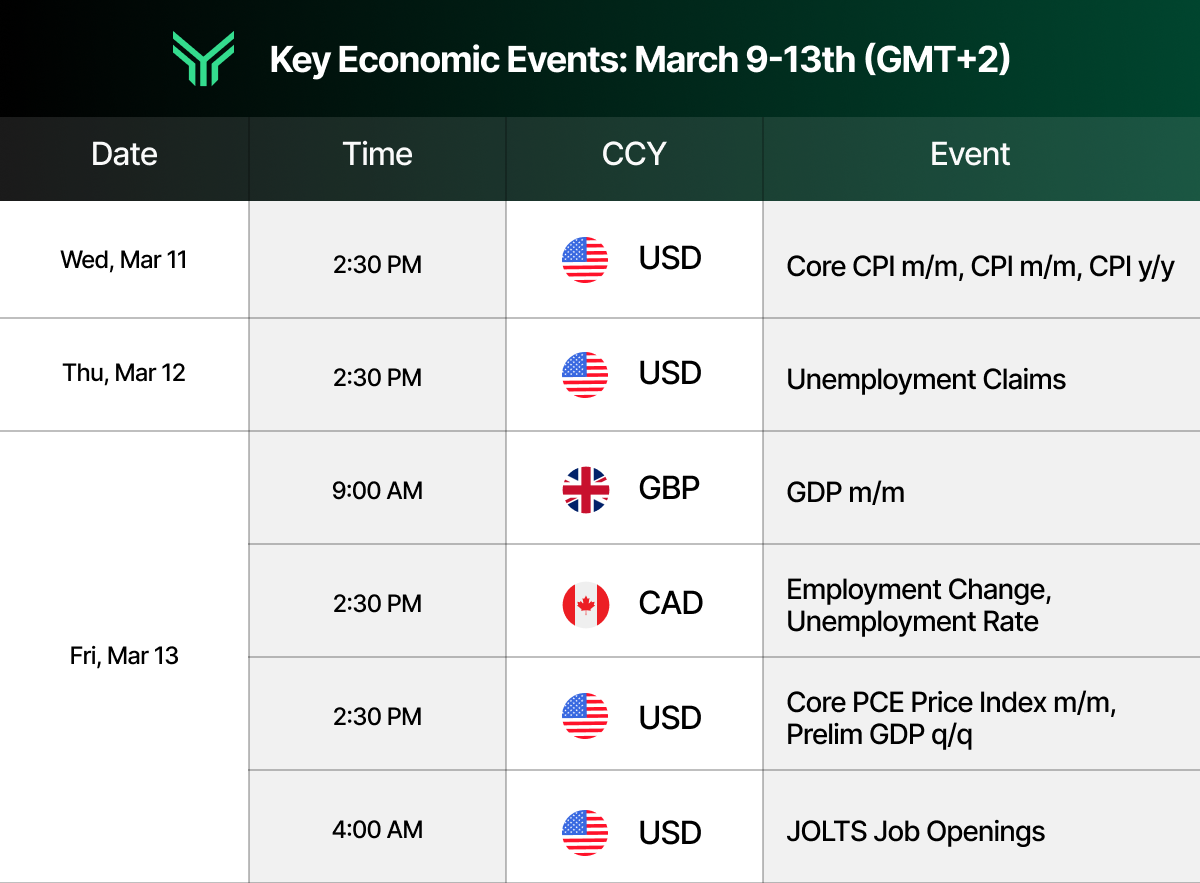
This condensed calendar is adapted from the Forex Factory economic calendar at forexfactory.com, a leading resource professional traders use to track market‑moving macro news and central bank events in real time.
Asset Watchlist: Market Intelligence Snapshot
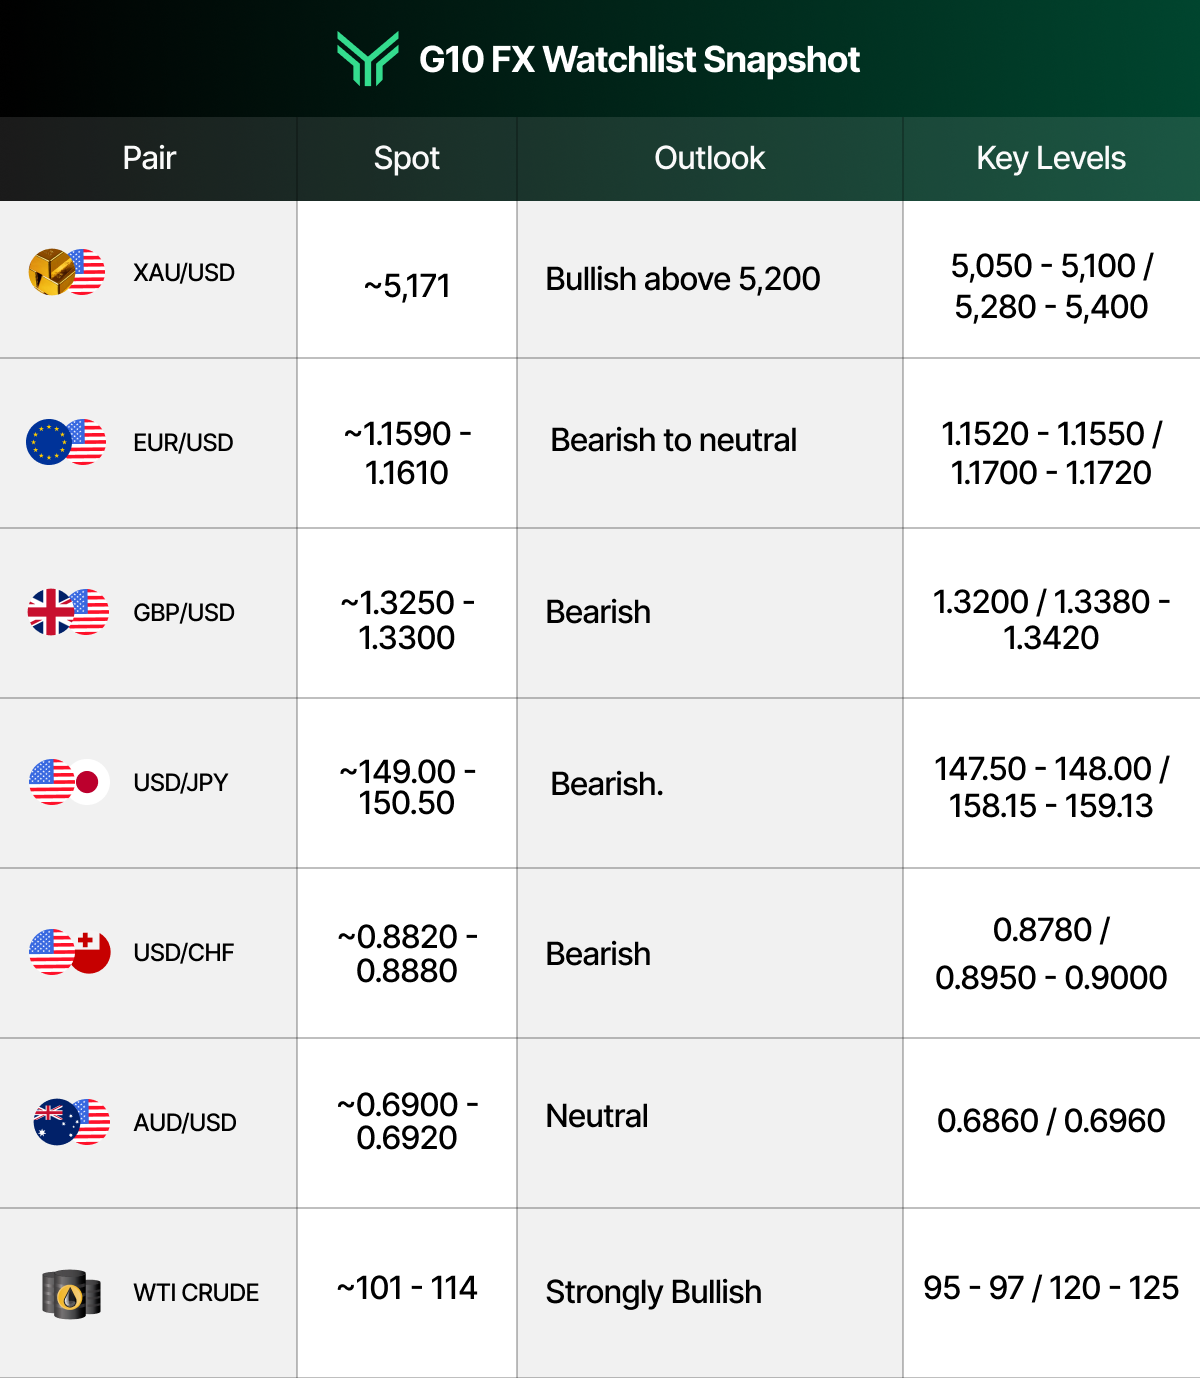
This table delivers market insights at a glance, helping traders quickly analyze key levels and understand current trends.
Actionable Insights for the Week to Drive Growth
The traders who look back on March 9 as a defining moment in their 2026 year will not be the ones who predicted the CPI number. They will be the ones who arrived Monday with a comprehensive methodology already in place, ready to respond to whatever the market delivers rather than building their reaction from scratch.
The framework is straightforward. This stagflationary shock is nine days old and not yet fully priced into equity valuations or bond yields. Wednesday’s CPI is the first binary event. The ECB meeting on March 17 is the second. Any Hormuz development is the third. Having a defined plan for each scenario before the week opens is the difference between being positioned and being reactive.
Phase one continues as long as WTI holds above $100 with no confirmed Hormuz reopening. A hot CPI print on Wednesday sends XAUUSD toward $5,300 to $5,400 while equities retest lows. That rewards traders who are long gold, short EUR/USD, and flat or short on risk-sensitive assets. It is not a complicated trade. It is a well-defined one.
A well-defined trade deserves well-funded capital. FundingTraders lets you keep 100% of your profits with the MADNESS code, plus 30% off every challenge. No limits, no cap. Show the market what your strategy can do.
Phase two begins at one of two triggers: the Strait reopens, generating violent reversals across all safe-haven trades, or the conflict extends and oil’s impact becomes visible in high-frequency economic data. In that second scenario, the stagflation playbook becomes the dominant framework across all asset classes, and the phase one trades continue working.
On the technical side, support and resistance levels remain relevant. The Break and Retest strategy works on oil, gold, and major forex pairs even in high volatility regimes. What changes is position sizing. In a week where WTI moves $10 in a session, sizing has to reflect that reality. Stay in the game, let defined levels do the work, and focus on process over prediction.
Generative AI tools and advanced data platforms can accelerate information processing, and that is a genuine innovation in how individual traders access market intelligence. But speed only creates an edge when paired with a framework for acting on it. Without defined levels and confirmed entry triggers, faster information is just faster noise. The edge still comes from discipline.
The knowledge base required to navigate a week like this is built through training, honest review of past performance, and the depth of preparation that turns volatile events into opportunities. Know your levels. Wait for confirmed setups. Size to survive being wrong. Volatile weeks are simply weeks with wider ranges, higher volume, and bigger opportunities for those who showed up ready.
Weeks like this are where funded traders separate themselves. If your strategy is ready but your capital isn’t, FundingTraders is running the MADNESS promo, 30% off every challenge plus a 100% profit split. Use code MADNESS at checkout and turn this volatility into real payouts.
Stay Ahead of the Market
These latest insights are built on the same research and analysis framework that has defined the FundingTraders approach throughout 2026. The goal is to give you a comprehensive view of the macro environment and the actionable intelligence that makes your trading decisions more grounded in what the data is actually showing, not to deliver a prediction to follow blindly.
We remain dedicated to helping traders at every level gain a deep understanding of global markets and the economic forces shaping them. Access the FundingTraders Help Center for detailed guides and platform support. Our team is focused on making sure you have everything you need to compete with confidence.
To learn more about who we fund, visit FundingTraders. Turn your market insights into income.
Disclaimer: This content is for informational and educational purposes only and does not constitute financial, investment, or trading advice. Trading forex and other financial instruments involves significant risk and may not be suitable for all investors. Past performance is not indicative of future results. Always conduct your own research and consult with a licensed financial advisor before making any trading decisions. FundingTraders is a proprietary trading firm and is not a broker-dealer or registered investment advisor.