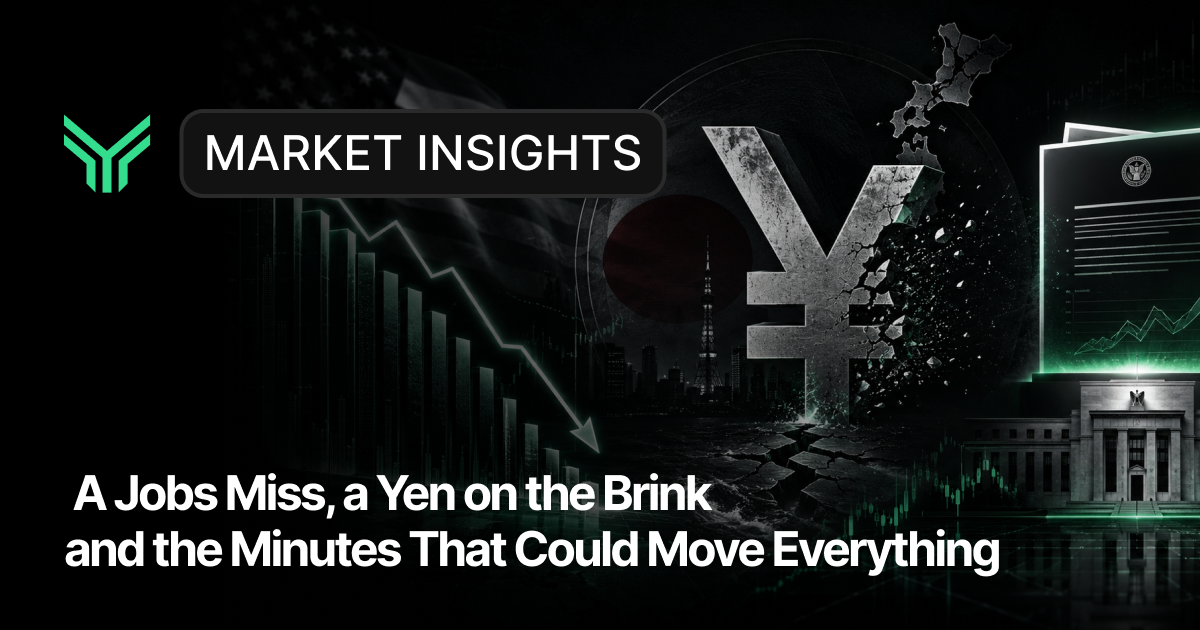
This week’s market insights center on an oil-shock inflation reckoning forcing investors across global markets to recalibrate. The US-Iran conflict has effectively closed the Strait of Hormuz, pushing WTI above $111 and threatening to embed energy-driven price pressures into the broader economy.
Friday’s March CPI report is the gravitational center of the week, with a 3.4% headline print expected, the largest monthly jump since the 2022 energy crisis. FOMC minutes on Wednesday and Core PCE on Thursday will reveal whether the Fed was already pricing this in or whether a painful recalibration lies ahead.
This is not a week for passive positioning. It demands timely market research, disciplined risk management, and a deep understanding of how geopolitical shocks transmit through commodity, currency, and equity channels. This quarterly market update covers gold, oil, forex, and equities with specific levels, institutional forecasts, and actionable insights to help our clients implement high-conviction strategies.
Quick Summary Box
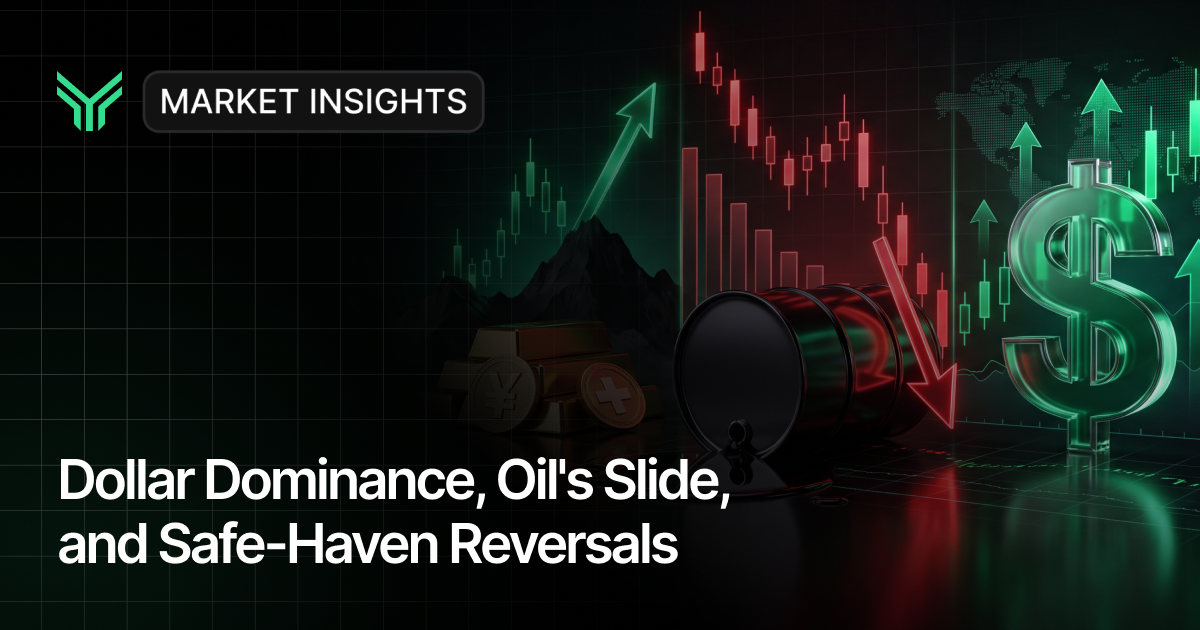
The tone entering the week: risk-on relief meets inflation reality. Equities bounced 3.4% last week on ceasefire hopes, but oil’s continued surge threatens to undo every basis point of that confidence. Gold (XAUUSD) is trading near $4,676, caught between safe-haven demand and rising real yields, with support at $4,540 and resistance at the 50-day MA near $4,800, Goldman Sachs maintains a $5,400 year-end forecast. WTI Crude Oil settled at $111.54, up nearly 12% last week, as the Strait of Hormuz closure keeps the geopolitical risk premium elevated and any de-escalation headline could trigger a $10+ reversal. The S&P 500 closed at 6,582.69, with resistance at 6,620 marking the upper limit of a month-long declining channel and Friday’s CPI acting as the binary catalyst. Meanwhile, the DXY (US Dollar Index) holds at 100.19, where safe-haven flows support the greenback despite structural bearish arguments, the 100 level remains the line in the sand.
Asset Breakdown: Market Research on Global Markets
XAUUSD (Gold): The Chaos Hedge Faces an Inflation Test
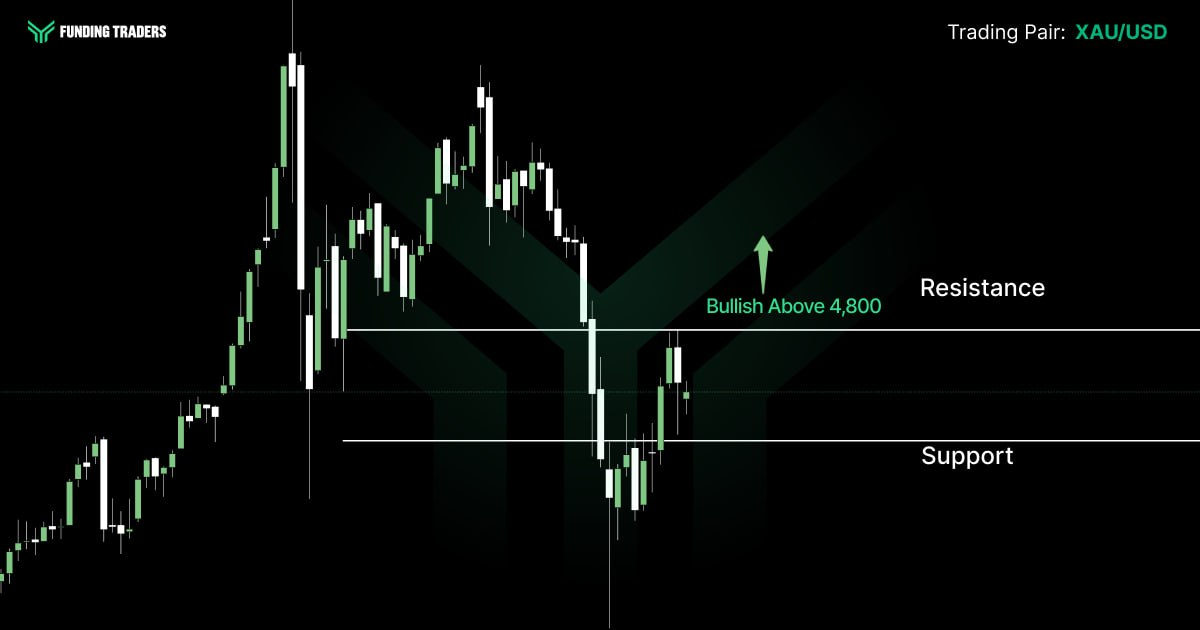
Gold is hovering around $4,676, down about 20% from January’s all-time high of $5,595. Iran tensions are offering some support, but sticky inflation and fading rate cut hopes are keeping a lid on prices.
The big banks still like gold long term. Goldman targets $5,400, JPMorgan $6,300, and UBS $5,600, all viewing the dip as a buying opportunity.
Watch $4,540 as key support and $4,800 as the level bulls need to crack. Thursday’s Core PCE and Friday’s CPI will set the tone for the rest of the week.
For traders looking to capitalize on gold’s volatility this week, preparation is the edge. FundingTraders gives you the capital to access high-conviction macro setups without risking your own funds. Visit FundingTraders and use code BUNNY for 40% OFF all accounts, plus Buy 1 Get 1 FREE this Easter.
EUR/USD: Energy Shock Weighs on the Euro
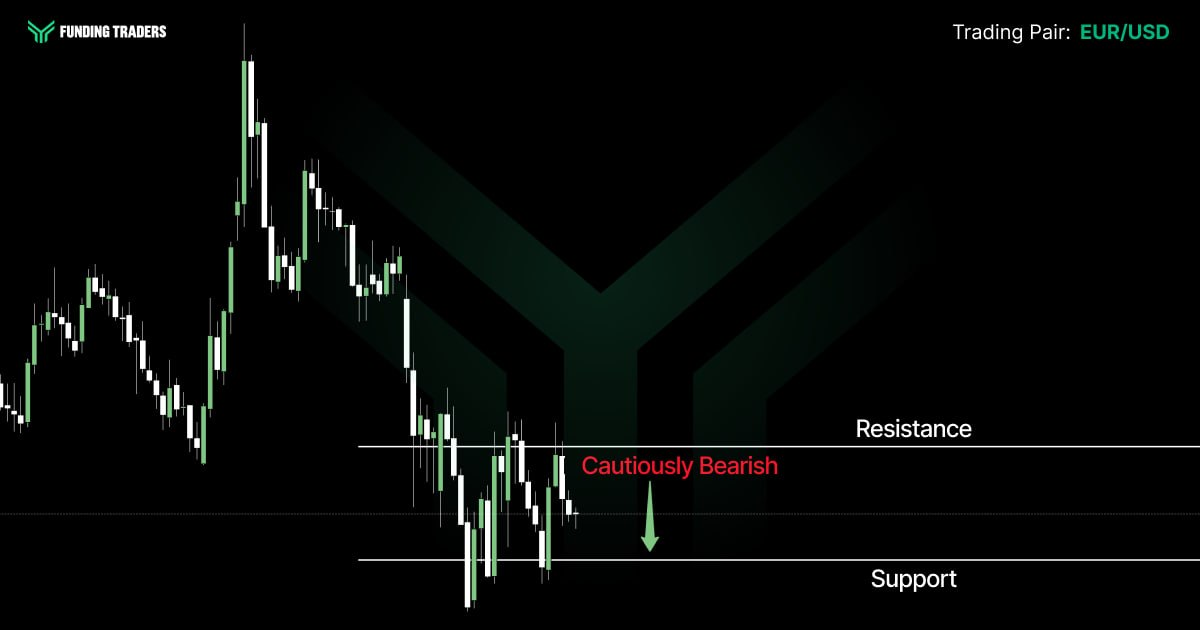
EUR/USD is trading around 1.1515, sliding from 1.1818 in early March as the oil shock hit European growth harder than the US. The Eurozone’s heavier exposure to Middle East energy disruption is the core problem, with rising energy costs squeezing consumer incomes.
The ECB has turned more hawkish, with Lagarde hinting at forceful action if energy prices keep climbing. MUFG sees two ECB hikes in 2026, which could support the euro, but only if recession is avoided.
Key levels are 1.1470 support and 1.1600 resistance. Longer term, a hiking ECB versus a on-hold Fed could favor the euro, but for now the dollar’s safe-haven appeal is still running the show.
GBP/JPY: Carry Trade Under Pressure
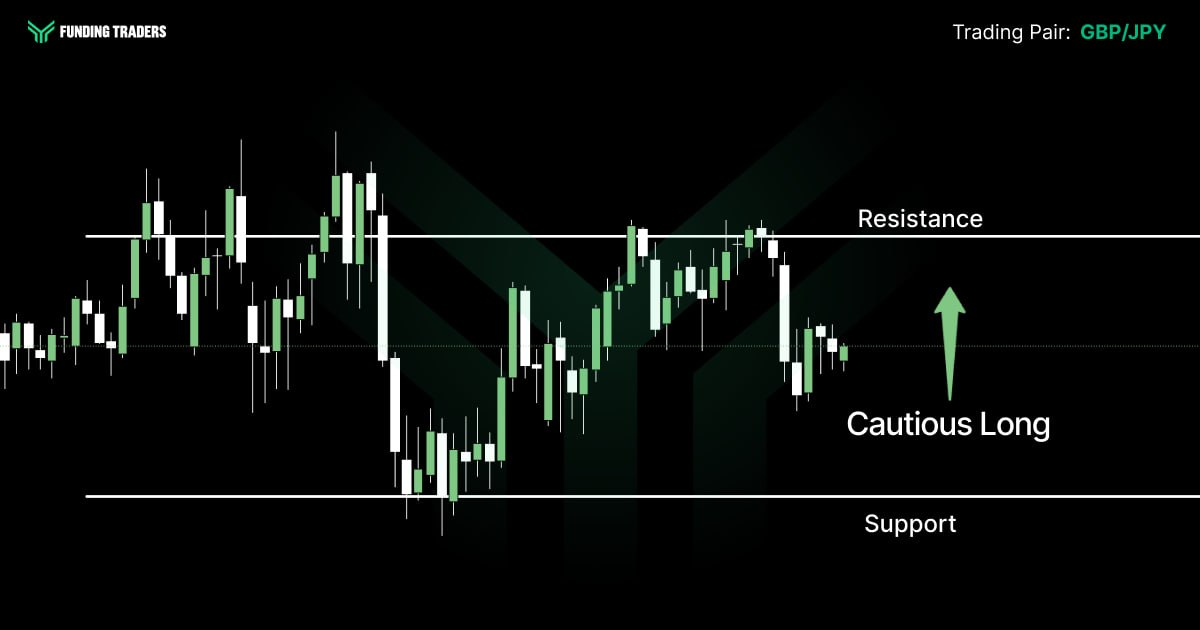
GBP/JPY is sitting in the 210 to 211 zone, a level that has historically put Japanese authorities on edge. Finance Minister Katayama already warned last week that bold measures are on the table if currency speculation continues, so intervention risk is very real here.
The Bank of Japan meets on April 28 with a 70% chance of a rate hike priced in. If they move, expect a sharp yen rally and a violent unwind of carry trades. The yen is widely considered the most undervalued currency in the G10, and that gap could close quickly if this week’s CPI data shows inflation becoming more entrenched.
USD/JPY: The 160 Line in the Sand
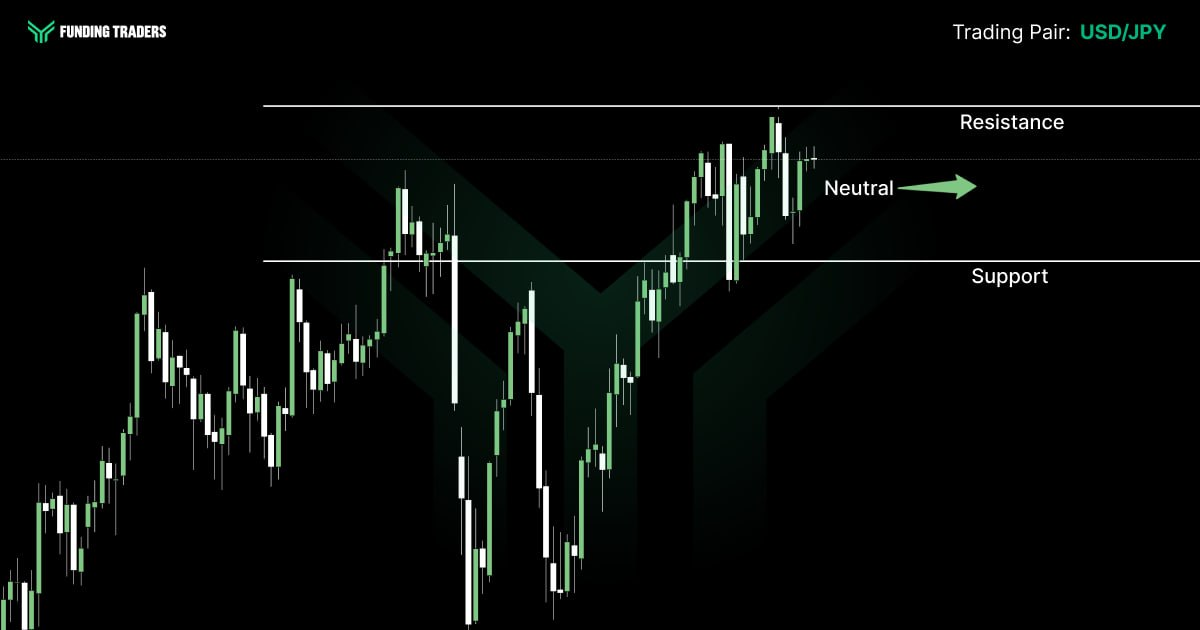
USD/JPY is hovering just below 160.00, the level that has historically prompted Japanese intervention. Strong US yields and dollar safe-haven demand are pushing it higher, while BoJ rate hike expectations and intervention risk are keeping a ceiling on the pair.
The BoJ’s new board member struck a cautious tone, but the broader committee looks ready to move. MUFG sees USD/JPY falling to 146.00 by year-end as Fed cuts and BoJ hikes drive yields closer together.
Thursday’s PCE and Friday’s CPI are the key events to watch. Hot numbers boost the dollar but also raise the pressure on Tokyo to act. The 52-week range of 139.88 to 160.48 tells you everything you need to know about how much is at stake here.
USD/CHF and AUD/USD: Diverging Fortunes
USD/CHF is at 0.8015 as the franc benefits from safe-haven flows and a passive SNB. If the Iran situation worsens, CHF has room to run. Watch 0.7900 support and 0.8150 resistance.
AUD/USD is holding up well at 0.6895 despite the risk-off mood, supported by Australia’s commodity exports and a 3.75% RBA rate. Key levels are 0.6700 support and 0.6940 resistance. Wednesday’s RBNZ decision could stir up some extra volume across AUD crosses if New Zealand turns dovish.
WTI Crude Oil: The Geopolitical Premium Is the Price
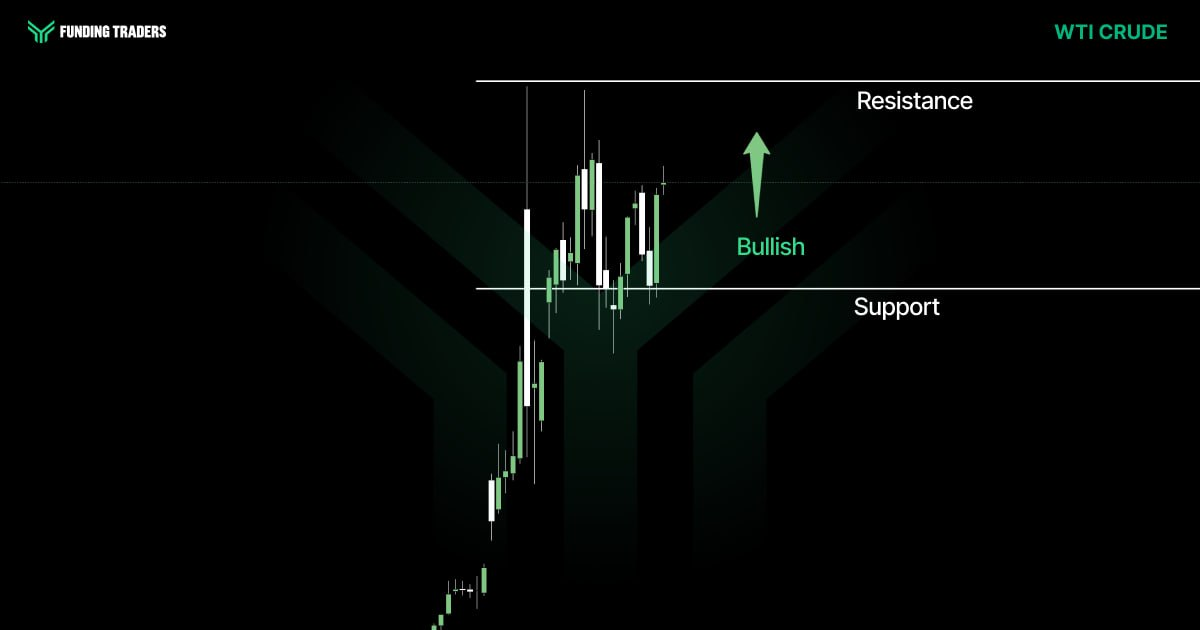
WTI crude settled at $111.54 last week, up 12% in a shortened trading week and 80% higher than a year ago. The Strait of Hormuz is effectively closed, making this the worst supply disruption since 1973.
This is no longer a tail risk, it’s the base case. Trump’s threats against Iranian infrastructure are keeping the market on edge. A diplomatic breakthrough could trigger a $10 to $15 drop in a single session, while Israeli strikes on Iranian energy facilities could push WTI toward $120 and beyond.
Wednesday’s EIA inventory report is the key data point this week. Last week’s 5.5 million barrel build suggests US supply isn’t as tight as global prices imply, and OPEC’s 206,000 bpd hike barely makes a dent against the millions of barrels stranded by the Hormuz closure.Oil volume and volatility at these levels create exactly the kind of directional opportunities that funded traders thrive on. If you’re ready to explore these moves with real capital behind you, FundingTraders is offering an Easter brand event you won’t want to miss. Visit FundingTraders and use code BUNNY for 40% OFF + Buy 1 Get 1 FREE on all accounts. Level up your trading game while the bunny brings the deals.
Key Economic Events: April 6 – April 10(GMT+3)
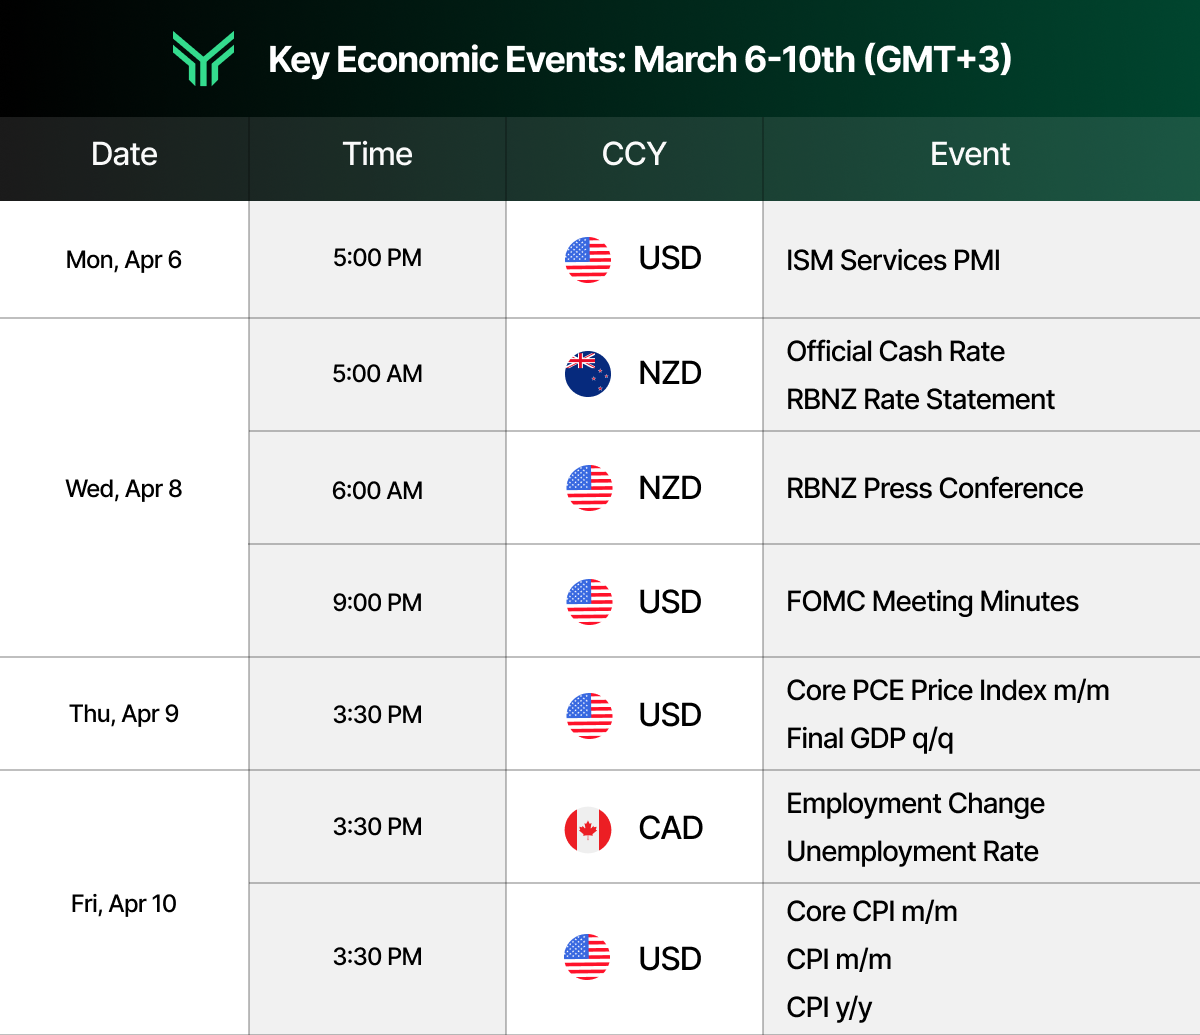
This condensed calendar is adapted from the Forex Factory economic calendar at forexfactory.com, a leading resource professional traders use to track market‑moving macro news and central bank events in real time.
Asset Watchlist: Market Intelligence Snapshot
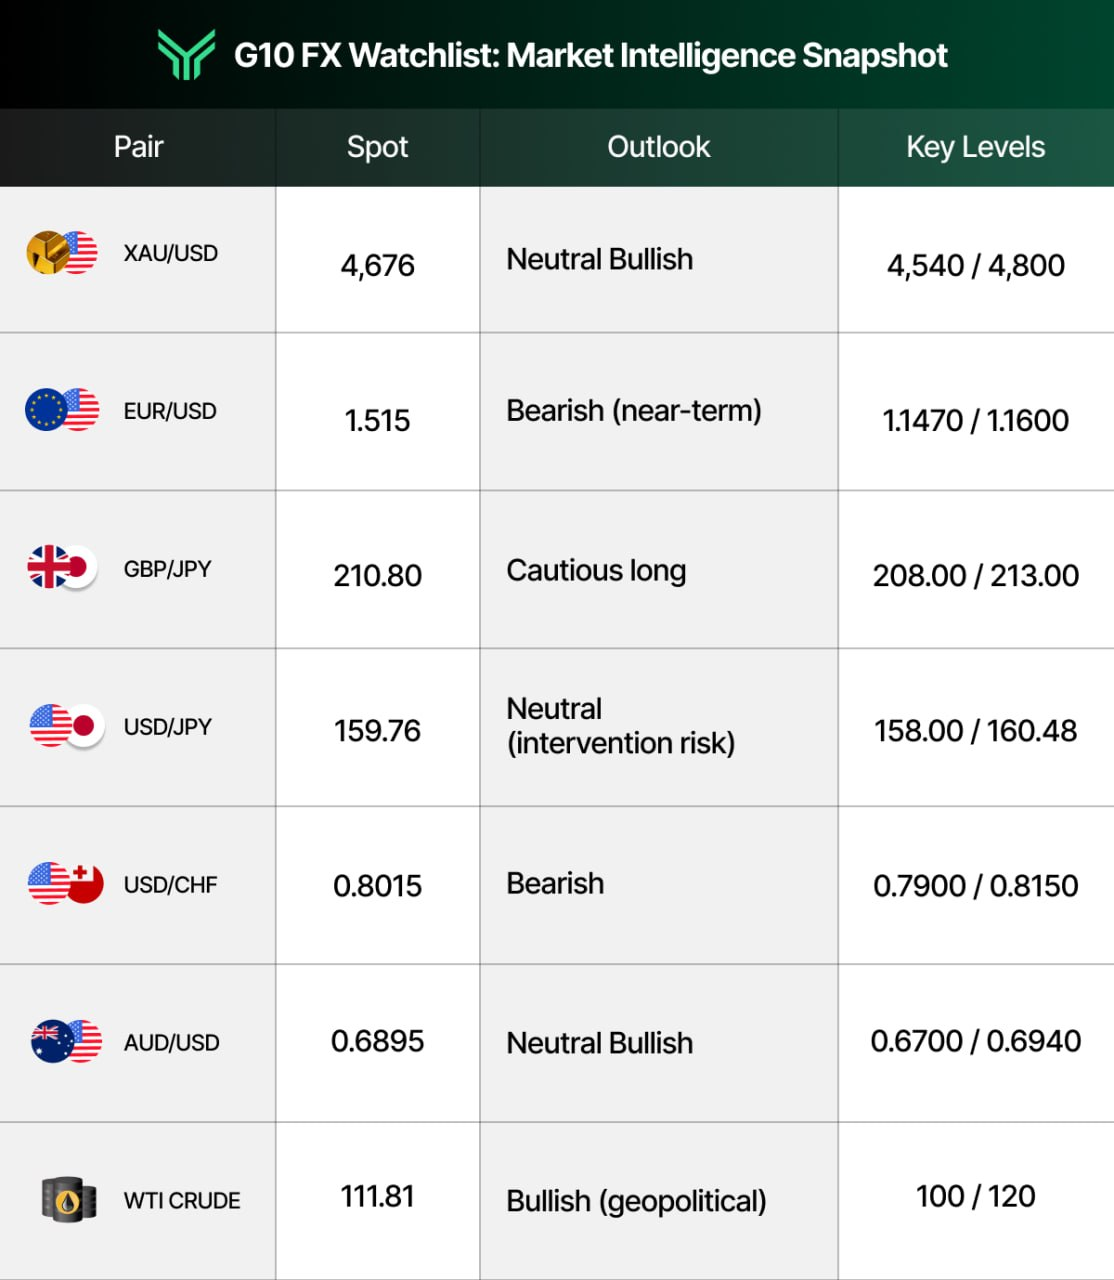
This table delivers market insights at a glance, helping traders quickly analyze key levels and understand current trends.
Actionable Insights for the Week to Drive Growth
Preparation is the trader’s edge, and this week rewards those who have done the work. The data calendar is stacked, geopolitical headlines will be unpredictable, and every asset class is sitting at a technically significant level.
The base case assumes no major Iran escalation and CPI printing near consensus at 3.4% headline and 0.3% core. Gold looks attractive on dips to the $4,540 to $4,580 zone targeting the 50 day MA at $4,800. Oil longs above $110 carry poor risk to reward given ceasefire risk could flush WTI back to $95 to $100. EUR/USD stays on a short bias below 1.1600 targeting 1.1470 on ECB and Fed divergence. The S&P 500 is a fade at 6,620 resistance unless core CPI surprises to the downside.
The scenario triggers are equally important to understand. A dovish CPI core print at 0.2% or below brings risk on across the board, rate cut expectations return, equities break above 6,620, and the dollar weakens. A hot print at 0.4% or above kills the transitory energy shock narrative, spikes yields, pressures gold, and sends the S&P toward 6,400 while the dollar rallies toward 101. Israeli strikes on Iranian energy infrastructure would spike oil toward $120, push gold toward $4,800, and trigger a sharp equity selloff. A ceasefire or Hormuz reopening flips the script entirely, collapsing oil by $15 to $20, fading gold, and sending equities and EUR/USD sharply higher.
Each scenario demands a different playbook. The dedicated trader will have orders and alerts set before the first headline drops.
Whether your thesis is oil-driven inflation, safe-haven gold, or a CPI-driven equity reversal, you need capital to project your view into the market. FundingTraders provides the infrastructure, the capital, and the services to help you innovate in your approach and gain real revenues from real trades. Start your funded trading journey at FundingTraders and don’t forget: CONGRATS! You just hatched 40% OFF + Buy 1 Get 1 FREE! Use code: BUNNY for 40% OFF ALL accounts! This Easter, level up your trading game while the bunny brings the deals.
Stay Ahead of the Market
This week is a defining moment for Q2 positioning across global markets. The collision of an active military conflict, an energy supply shock, and the most anticipated CPI print in years creates a complex environment where knowledge and preparation are everything.
Market insights built on solid research and a comprehensive methodology will separate the traders who capitalize from those who get caught.
FundingTraders remains dedicated to helping clients across multiple geographies access the capital they need to trade these macro setups. Our team provides the services, training, and actionable intelligence that help businesses and individual traders stay ahead and drive growth in even the most volatile conditions, grounded in leading research from across the globe.
Whether you’re a seasoned macro trader or just beginning to analyze how economic events shape price, this week offers no shortage of setups.
Every participant in the world economy is watching the same data. The question is who acts with precision.
Disclaimer: Trading involves significant risk and is not suitable for every investor. Past performance is not indicative of future results. The information provided in this article is for educational and informational purposes only and should not be considered financial, investment, or trading advice. All account rules, payout structures, profit splits, and promotional offers described in this article are subject to change at the discretion of FundingTraders. Promo codes may expire or be modified without prior notice. Always trade responsibly and only risk what you can afford to lose.