This week’s Market Insights opens on an unusual kind of relief. A fragile Middle East ceasefire has finally pulled energy prices off the boil, but instead of celebrating, traders are watching almost every major central bank brace to raise rates rather than cut them. The Federal Reserve, the European Central Bank, the Bank of England and the Bank of Japan have all turned tougher on inflation, and that shift is reshaping global markets, lifting the dollar and squeezing anything priced against it. The market research below lays out the setup, the latest insights that matter most, and the jobs data that could set the tone for the rest of the summer.
Quick Summary Box
The mood entering the week is cautious risk-taking under a firm dollar, with traders caught between cooling oil and stubborn inflation. Gold has slipped from its record run as the safe-haven panic fades and a stronger greenback weighs on it, leaving buyers to defend a key psychological line. WTI crude has tumbled back toward levels last seen before the conflict, pressured by reopening shipping lanes and returning supply, though any fresh flare-up could snap it higher within hours. US equities, led by the S&P 500, are hovering near records on the strength of company earnings, even as nerves about the cost of the AI build-out keep technology shares choppy. And the dollar, measured by the DXY, sits near a one-year peak as hawkish policy and higher yields pull money its way. With a shortened holiday week and a pivotal jobs report ahead, the data will do the talking.
Asset Breakdown: Market Research on Global Markets
These Market Insights dig into the research behind each of the week’s biggest moves across global markets, where prices sit, the levels that matter, and what the leading institutions are forecasting.
XAUUSD (Gold)
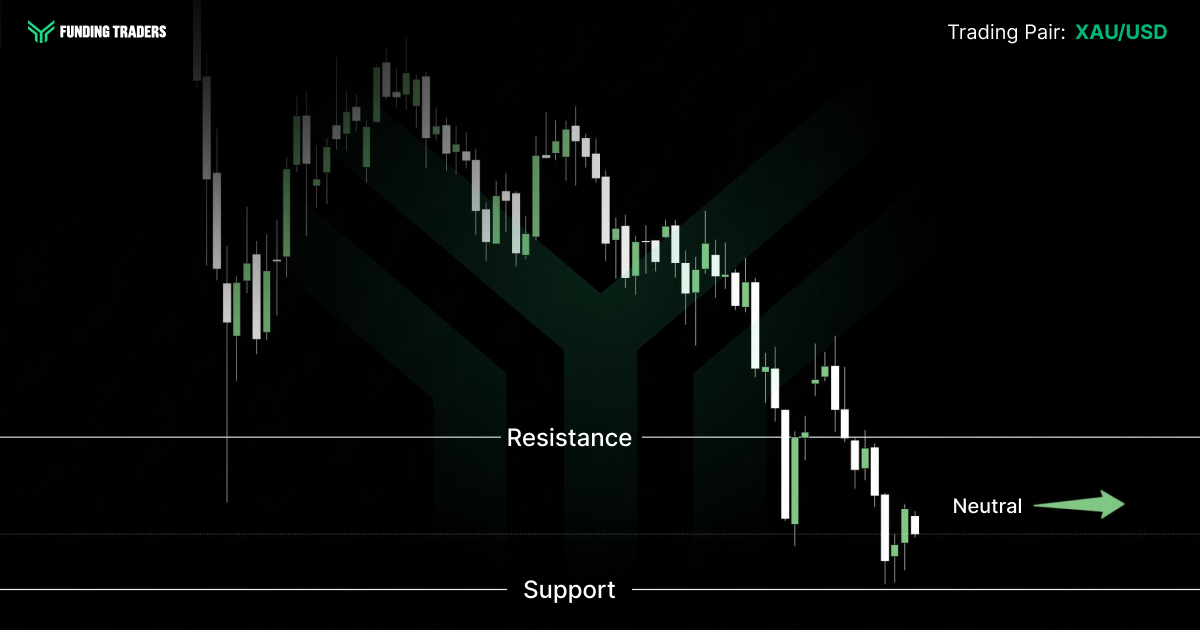
Gold has spent three months unwinding the panic that drove it to a January record near $5,600. With the ceasefire holding and the safe-haven bid draining away, the metal has slid into the low-$4,000s and is now fighting to keep the $4,000 handle, a level traders treat as the line in the sand. A firmer dollar and the prospect of higher US rates have done most of the damage, since gold pays no yield and struggles when cash does.
Below $4,000, the next shelves sit near $3,950 and $3,870; on the upside, sellers are camped around $4,100 and the $4,185–$4,210 supply zone, with the 50–61.8% retracement band near $4,320–$4,380 capping any larger bounce. Short-term signals lean bearish, but the longer-term picture is finely balanced, this is still a market one headline away from a sharp reversal.
What to watch: Thursday’s jobs report. A soft payroll number would push rate-hike bets back and could hand gold a quick rebound, while strong data and a stronger dollar keep the pressure on.
Gold’s swings this week are exactly the kind of move that rewards a trader who can act on a headline without restrictions. At FundingTraders you can trade the news freely on a funded account, start your evaluation and use code FT50 for 50% off any challenge from $5K to $200K.
EUR/USD
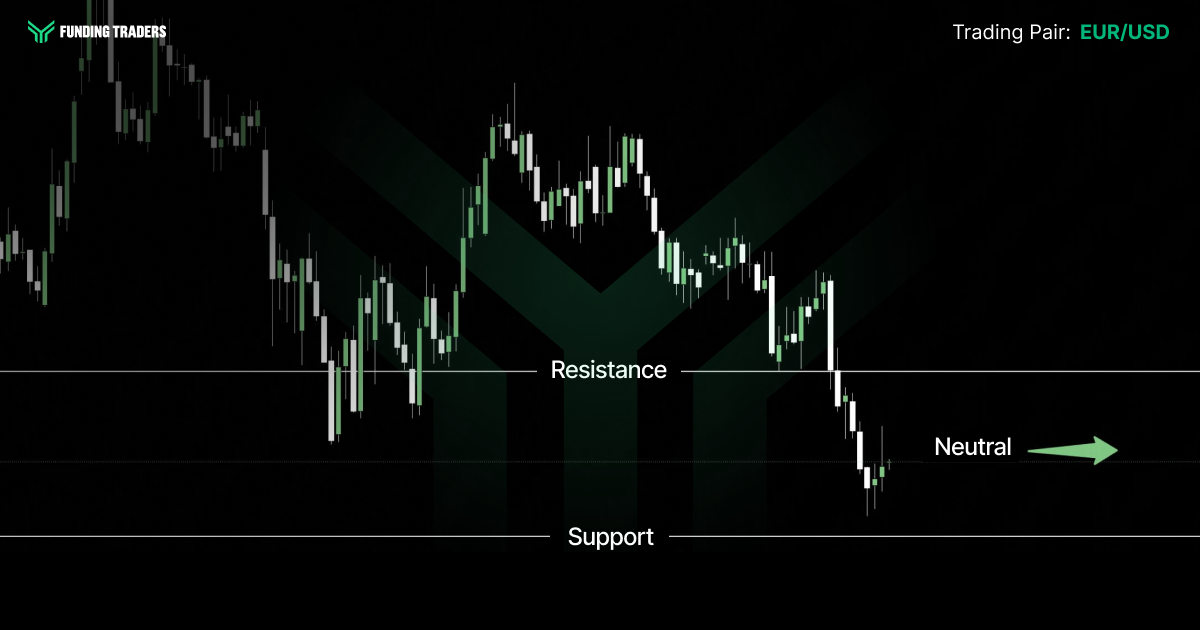
The euro is doing something that confuses a lot of people: the European Central Bank raised rates in June for the first time since 2023, lifting its deposit rate to 2.25%, and yet the single currency still can’t get off the floor. The reason sits on the other side of the pair. The dollar has firmed sharply as the Federal Reserve turned hawkish, so EUR/USD has drifted toward 1.14, the soft end of the range it has held all year after peaking above 1.20 in January.
For now the pair is stuck mid-range, with 1.14 acting as support and 1.15 as the ceiling it keeps failing to clear. A slip below 1.14 opens room toward the spring lows; a clean break above 1.15 would need a genuine dollar wobble. The banks remain longer-term bulls, Goldman Sachs and Deutsche Bank project 1.25 by year-end, with JPMorgan and ING nearer 1.22, but those calls were set before the June pivot. Tuesday’s eurozone inflation flash, and the cooling-versus-sticky inflation debate, are the near-term swing factors.
GBP/JPY
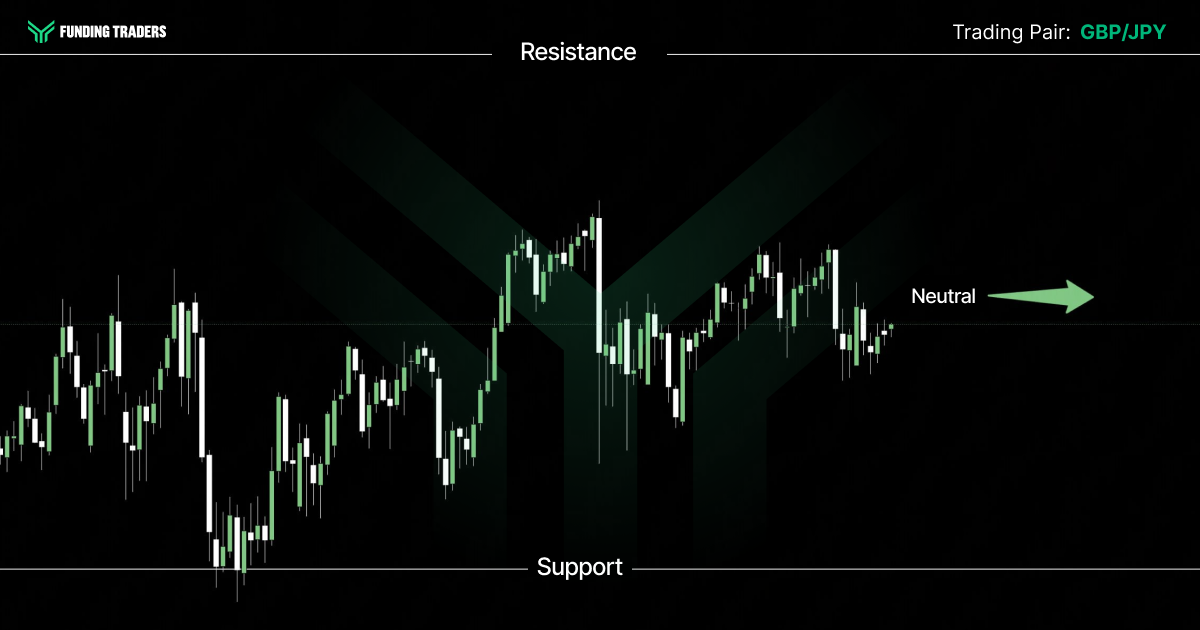
GBP/JPY is the market’s favourite carry trade, and it remains perched near 214, extraordinarily high against a ten-year average closer to 157. The pound buys far more yen than history says it should, and the reason is the rate gap: the Bank of England is holding at 3.75% while the Bank of Japan has only just nudged its rate to 1%. That gulf keeps paying traders to be long the pair.
But the cracks are widening. The Bank of Japan is slowly normalising and Tokyo keeps warning it could step in to defend the yen, which caps how far the pair can run. On the pound side, the surprise resignation of UK Prime Minister Keir Starmer has injected political and fiscal uncertainty that gilt and currency markets are still digesting. Support sits near 211 and then the February low around 208; resistance comes in near 217–220. Expect this pair to stay jumpy, carry trades can reverse 3–5% in a matter of days, one of the clearest risks on the board.
USD/JPY
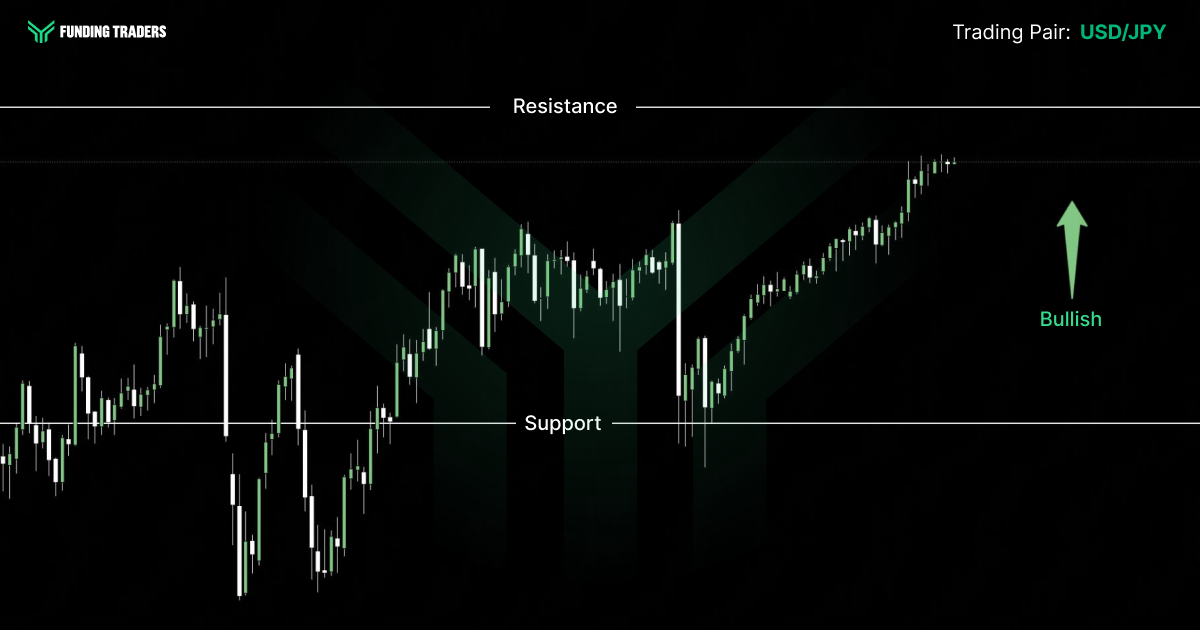
The yen is the weakest it has been against the dollar since 1986, with USD/JPY hovering around 161.6 and pressing on the 162–163 zone that traders now treat as Japan’s intervention line. Tokyo has already spent record sums defending its currency this year, and Finance Ministry officials keep reminding markets they will act again if moves get disorderly.
The tug-of-war is simple: the wide US–Japan rate gap and a hawkish Fed pull the pair higher, while the threat of intervention and a slowly tightening Bank of Japan pull it back. That standoff has pinned price just under the danger zone. Forecasts are split, JPMorgan sees 164 on persistent dollar strength, while ING and Scotiabank look for a drift toward 150–153 as the gap narrows. A push through 163 would test Tokyo’s resolve; a sharp drop below 159 would hint the intervention crowd has won.
USD/CHF and AUD/USD
Two more pairs tell the same story from different angles: a strong dollar meeting cautious central banks. USD/CHF has climbed toward the 0.80 area, a level that has capped it before. The Swiss National Bank is sitting at 0% and has made clear it would rather intervene than let the franc rip, but the franc’s safe-haven appeal means any fresh risk-off shock could quickly drag the pair back down.
AUD/USD, meanwhile, is languishing near 0.69 at its lowest in about two months. The Reserve Bank of Australia is one of the more hawkish central banks around at 4.35%, which would normally support the Aussie, but softer-than-expected Australian inflation has cooled bets on further hikes, and a weaker commodity backdrop plus risk-off flows have done the rest. Watch the 0.80 line on the franc and the 0.70 area on the Aussie; banks such as NAB and Scotiabank see AUD/USD only edging back toward 0.70 by year-end.
WTI Crude Oil
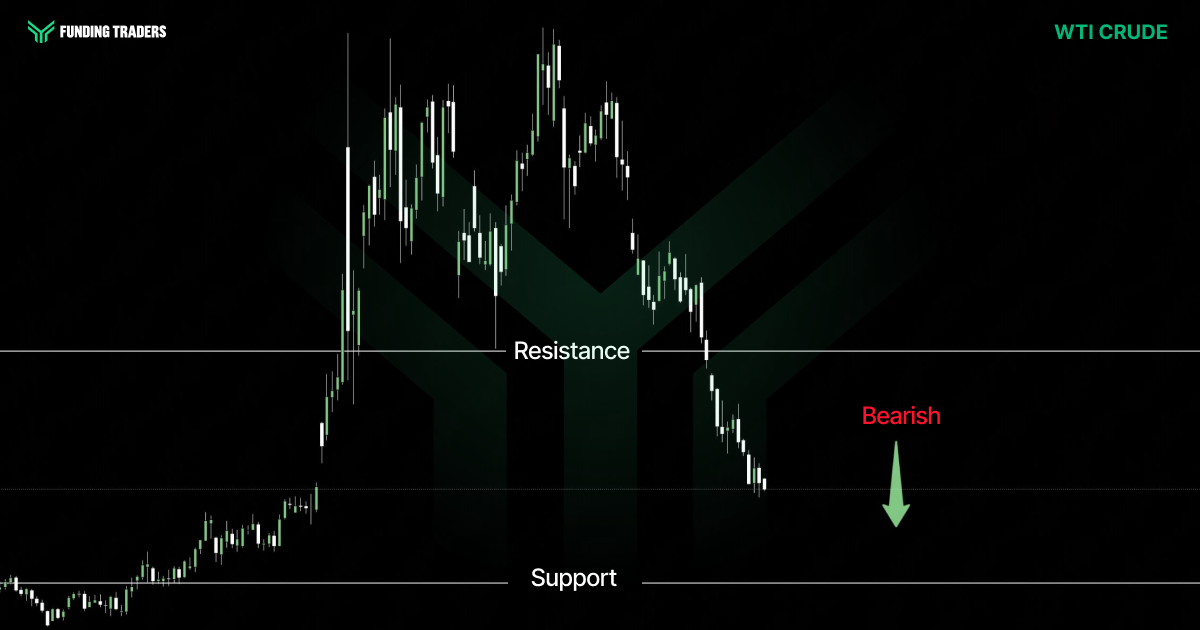
Oil has been the release valve for the whole market. After Brent spiked above $120 during the worst of the conflict, WTI crude has collapsed back toward $69, its lowest in four months and down more than a fifth in a single month. The trigger is supply coming back online: shipping through the Strait of Hormuz has recovered to roughly three-quarters of pre-war levels, and Saudi Arabia has restarted loadings at its main export terminal.
Even so, this is not a calm market. Fresh tit-for-tat strikes nudged prices higher to start the week, and the energy agencies warn that fully restoring Gulf flows could run into 2027. Barclays still pencils in Brent averaging around $100 for the year if navigation normalises soon, meaningfully above where crude trades today. Support sits near $65, with resistance around $76 and then the $87 shelf. The single biggest risk for every other asset on this page is that the ceasefire breaks and this chart snaps violently higher.
Key Economic Events: June 29 – July 3 (GMT+3)
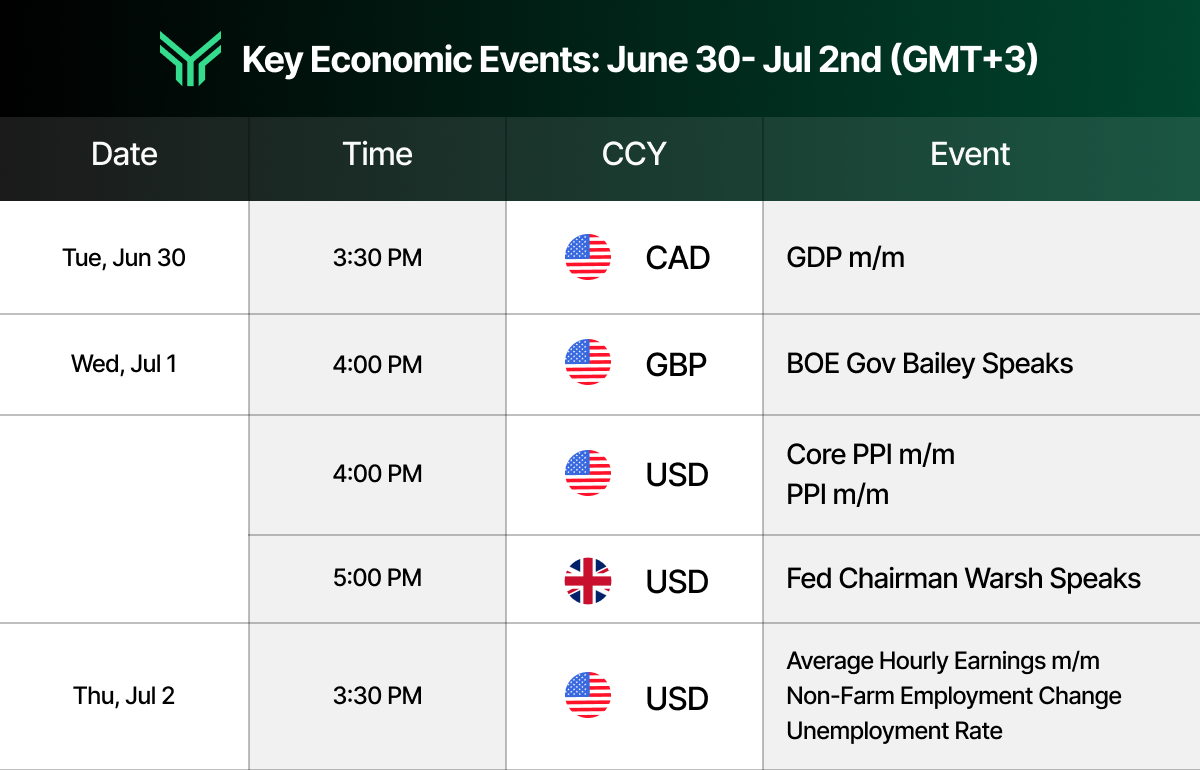
This condensed calendar is adapted from the Forex Factory economic calendar at forexfactory.com, a leading resource professional traders use to track market‑moving macro news and central bank events in real time.
Asset Watchlist: Market Intelligence Snapshot
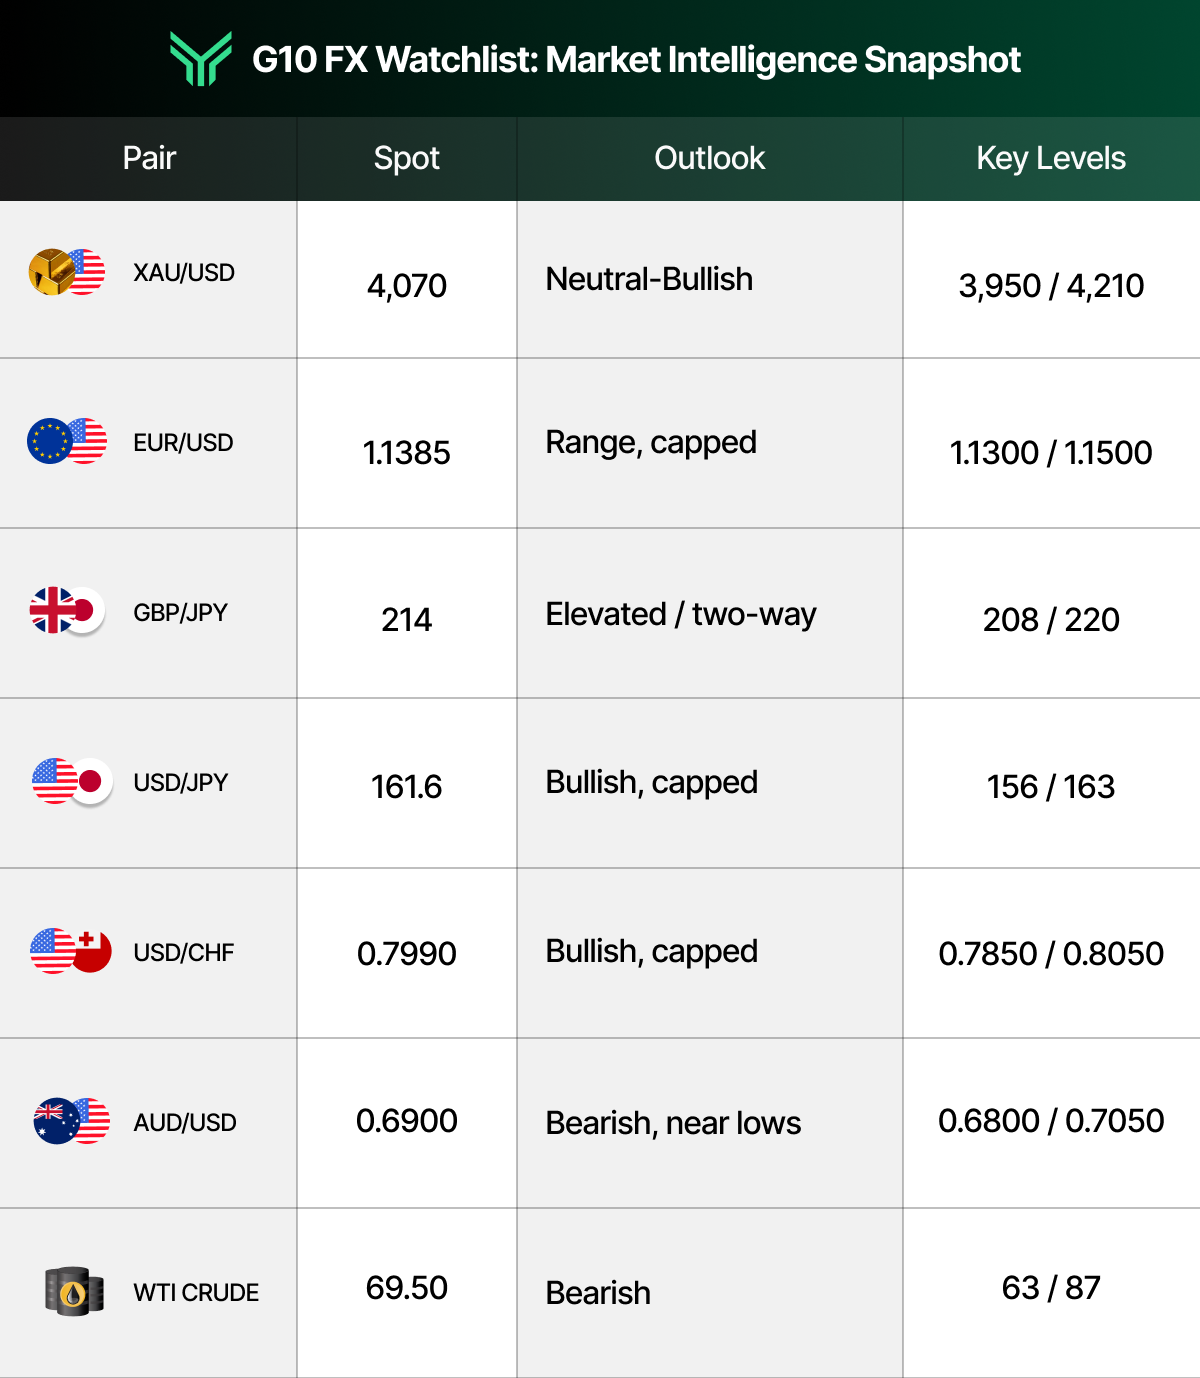
All levels are drawn from current technical research and are reference points, not guarantees.
Actionable Insights for the Week to Drive Growth
Preparation is the only real edge a trader controls, and in a holiday-shortened week with a jobs report in the middle, a plan written down beats reacting on the fly. Our dedicated research team builds these calls from a comprehensive methodology that blends live data, analyst commentary and probability-weighted forecasts into actionable intelligence you can act on, not vague predictions.
The base case. The path of least resistance is dollar strength on hawkish policy. That argues for leaning with the trend: expecting the dollar to stay firm against the euro and the Aussie, treating gold rallies into resistance as places to fade rather than chase, and respecting that oil is in a downtrend until the ceasefire actually breaks. In equities, the S&P 500’s strength deserves respect, but position sizes should account for headline risk around Thursday’s data. Sound risk management, sensible position sizing and a clear view of your account’s drawdown limits, matters more than any single call. A deep understanding of the competitive landscape, the future trends in policy, and the weaknesses hiding in the calendar is what helps serious investors gain an edge.
The triggers. A weak payrolls print is the headline that flips the script: it would knock back rate-hike bets, pressure the dollar, and reveal room for gold and risk assets to bounce. The other live trigger is geopolitical, any renewed strike that threatens the Strait of Hormuz would send oil sharply higher and revive the safe-haven trade in a heartbeat. The freedom to trade those events the moment they hit, without restriction, is what separates a funded setup from a hobby, and it’s where having timely intelligence and the right access to capital pays off.
A plan is only as good as the account behind it. Put your Phase One and Phase Two ideas to work, unrestricted news trading and weekly payouts, head to FundingTraders now and apply code FT50 to claim 50% off before the month closes.
Stay Ahead of the Market
The thread running through this week’s Market Insights is a world that has collectively decided inflation is the enemy again. The energy shock from the Middle East lit the fuse, and now the Federal Reserve, the ECB, the Bank of England and the Bank of Japan are all leaning the same hawkish way, a backdrop that keeps the dollar firm and forces a rethink of nearly every trade. From currencies to commodities to equities, this comprehensive view of global markets is built to inform and guide businesses, traders and clients across geographies as conditions shift around the globe.
For traders, the job this week is simple to state and hard to do: stay nimble around the jobs report, keep one eye on the Strait of Hormuz, and don’t fight the dollar until the data tells you to. The highest-conviction setups are the ones built on this macro framework, not against it. That’s where having real capital behind a disciplined plan, and the confidence to implement it, changes everything.
Disclaimer: Trading involves significant risk and is not suitable for every investor. Past performance is not indicative of future results. The information provided in this article is for educational and informational purposes only and should not be considered financial, investment, or trading advice. All account rules, payout structures, profit splits, and promotional offers described in this article are subject to change at the discretion of FundingTraders. Promo codes may expire or be modified without prior notice. Always trade responsibly and only risk what you can afford to lose.