Market insight this week begins with a single, inescapable reality: the world is repricing risk in real time. As the US-Iran conflict intensifies and energy market disruptions deepen, traders across global markets face one of the most complex macro environments in years. The data is clear, inflation is re-accelerating, economic growth forecasts are being slashed, and central banks from Washington to Sydney are caught in a policy bind. This market research report delivers the latest insights, actionable intelligence, and forecast frameworks you need to navigate March 23–27, 2026, with confidence. Whether you analyze crude oil, gold, or forex, this week’s events will shape the trading landscape for weeks to come.
Quick Summary Box
This week’s tone is defined by risk-off dominance as geopolitical escalation collides with hawkish central bank rhetoric, creating a stagflation corridor that punishes both equities and bonds. Gold (XAUUSD) is trading near $4,492/oz after pulling back 4% last week, though the primary trend remains bullish with support at $4,373 and resistance near $4,882, safe-haven demand is likely to resume on any further escalation. WTI Crude Oil sits at $98–100/bbl as the Strait of Hormuz disruption keeps prices elevated near 2022 highs, with volume surging on supply-side fears. The S&P 500 has fallen for four consecutive weeks to around 6,506, deeply oversold but still lacking a catalyst for reversal, with the 200-day moving average at roughly 6,620 acting as key resistance. The DXY (US Dollar Index) is hovering between 99.4 and 99.8, supported by safe-haven flows but capped by hawkish commentary from the ECB, BoE, and BoJ, leaving it range-bound with a mild bullish bias. EUR/USD remains bearish near 1.1549 under pressure from a stronger dollar and a weakening Eurozone growth outlook, while GBP/USD is treading water at 1.3341 as traders await Wednesday’s UK CPI data, with the hawkish Bank of England providing some underlying support.
Asset Breakdown: Market Research on Global Markets
XAUUSD (Gold): The Safe Haven Under Siege
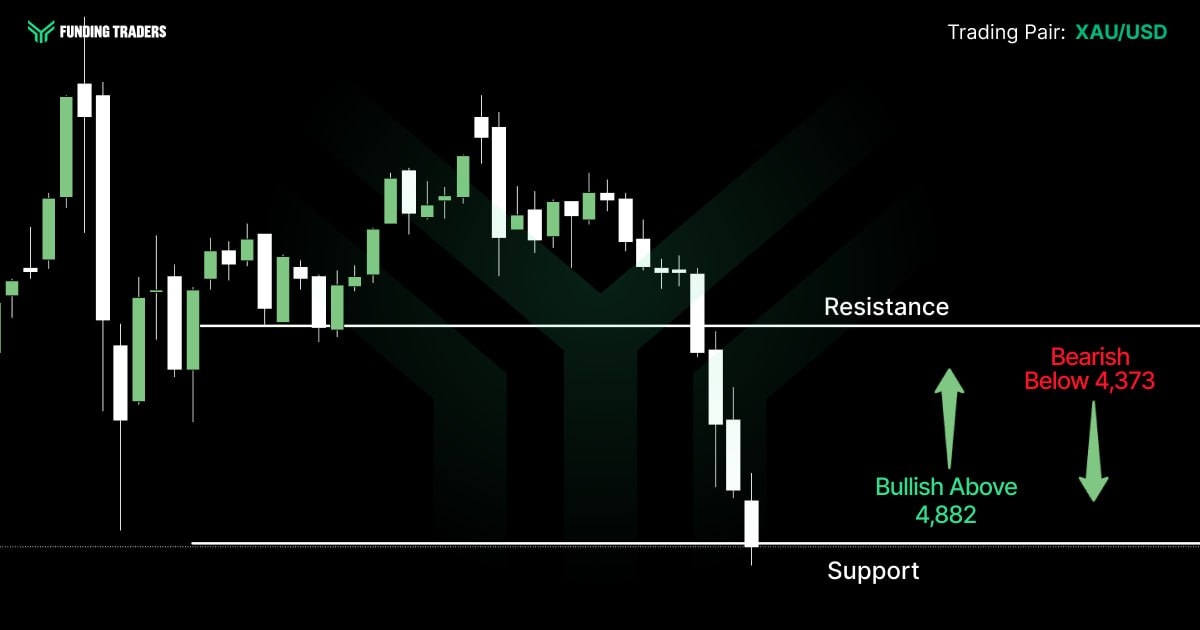
Gold fell roughly 4% last week to close near $4,492 per ounce, making it the sharpest weekly drop since January. The selloff was fueled by rising Treasury yields (10-year hit 4.38%), a firming dollar, and forced liquidation as traders repositioned before the weekend. That said, the bigger picture is still bullish, with gold trading comfortably above its yearly open of $4,325.
This looks more like a positioning shake-out than any real shift in fundamentals. If anything, the safe-haven argument is getting stronger as Middle East tensions keep escalating, especially after Trump issued a 48-hour ultimatum to Iran. Several major institutions still expect gold to push higher into April. Support to watch is $4,373, and resistance sits around $4,882.
If you’re looking to trade this, keep an eye on Monday’s open. If gold holds above $4,400 on any early-week weakness, that’s a sign institutional buyers are stepping in and it could be a solid entry for longs targeting $5,000 and beyond. On the flip side, a clean break below $4,373 would suggest a deeper pullback toward $4,160 is in play.
If you’re looking to capitalize on gold’s heightened volatility, FundingTraders gives you the capital and platform to trade high-conviction macro setups without risking your own savings. Use code MADNESS for 30% off every challenge plus 100% profit split, you keep it ALL. Start your challenge.
EUR/USD: ECB Hawks vs. Dollar Strength
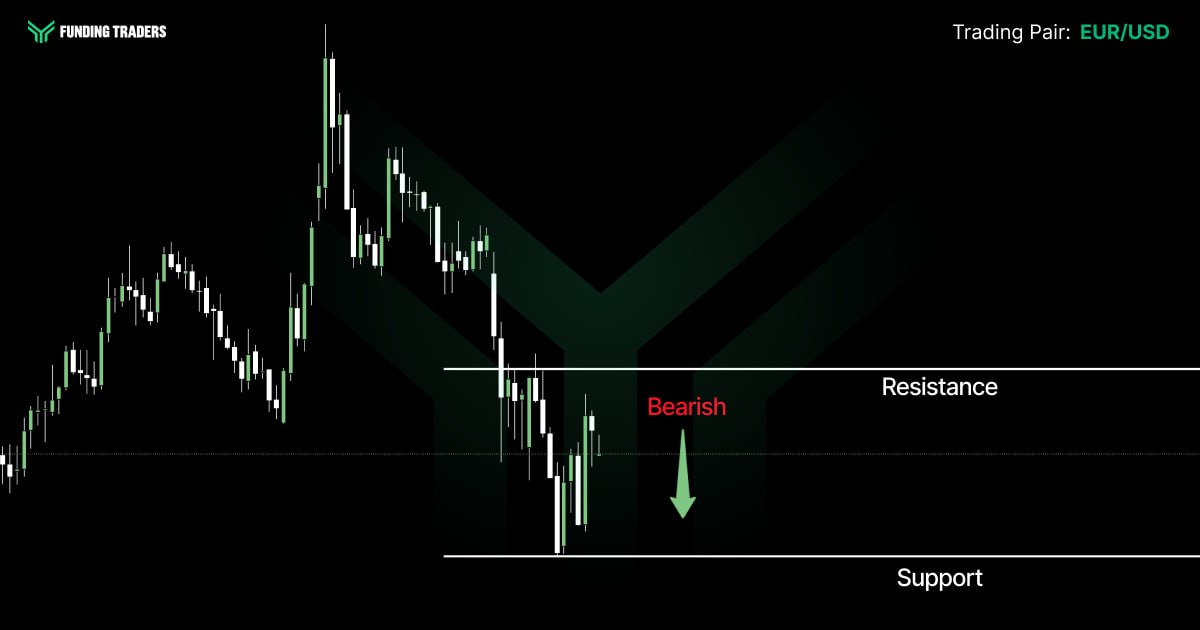
The euro closed the week near 1.1549 against the dollar, extending its March slide from the 1.1950 area. The ECB held rates at 2.15% but cut its 2026 growth forecast to just 0.9% while raising inflation expectations to 2.6%. The Eurozone economy is getting squeezed by the energy shock, and the euro is taking the hit.
The medium-term trend points lower, with the 1.1412 to 1.1434 zone as the next target. A break below that could open the door to 1.1196. For any meaningful bounce, bulls would need to reclaim 1.1648. Tuesday’s flash Eurozone PMI data is the next big catalyst, and weak numbers would only confirm the growth deterioration and likely speed up the euro’s decline.
One thing worth watching is the relationship between EUR/USD and crude oil. As energy costs climb, Europe’s trade deficit widens, putting structural pressure on the euro. That makes shorting EUR/USD a natural way to express the current macro environment.
GBP/USD: Hawkish BoE, but Vulnerable to Oil
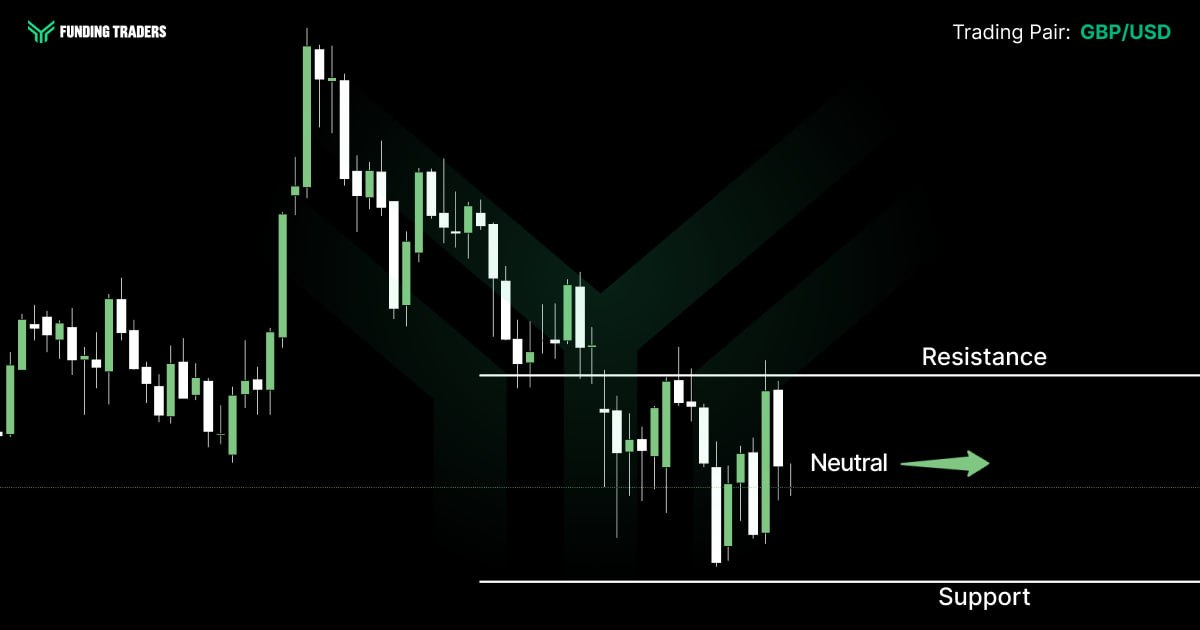
Cable is trading near 1.3341, hovering around its 200-hour moving average at 1.3354. The Bank of England held rates at 3.75% last week with a unanimous 9-0 hawkish decision, scrapping forward guidance and signaling readiness to act if inflation picks up further. The UK rates market is now pricing in 64 basis points of hikes for the rest of 2026.
Wednesday’s UK CPI print is the big one for sterling this week. Expectations are for headline inflation to tick up to 3.1% from 3.0%, with core holding around 3.2%. A hotter number would boost rate hike bets and could push GBP/USD toward 1.3450, while a miss could drag it down to 1.3200 support. BoE Governor Bailey has flagged that energy costs are already feeding into consumer prices, with internal forecasts showing UK CPI could hit 3.5% by Q3 2026.
Worth noting that GBP is one of the cleaner ways to play a hawkish central bank trade without piling into long dollar positions. Sterling benefits from rate differential expectations while sidestepping the crowded long USD trade.
USD/JPY: Energy Shock Hammers the Yen
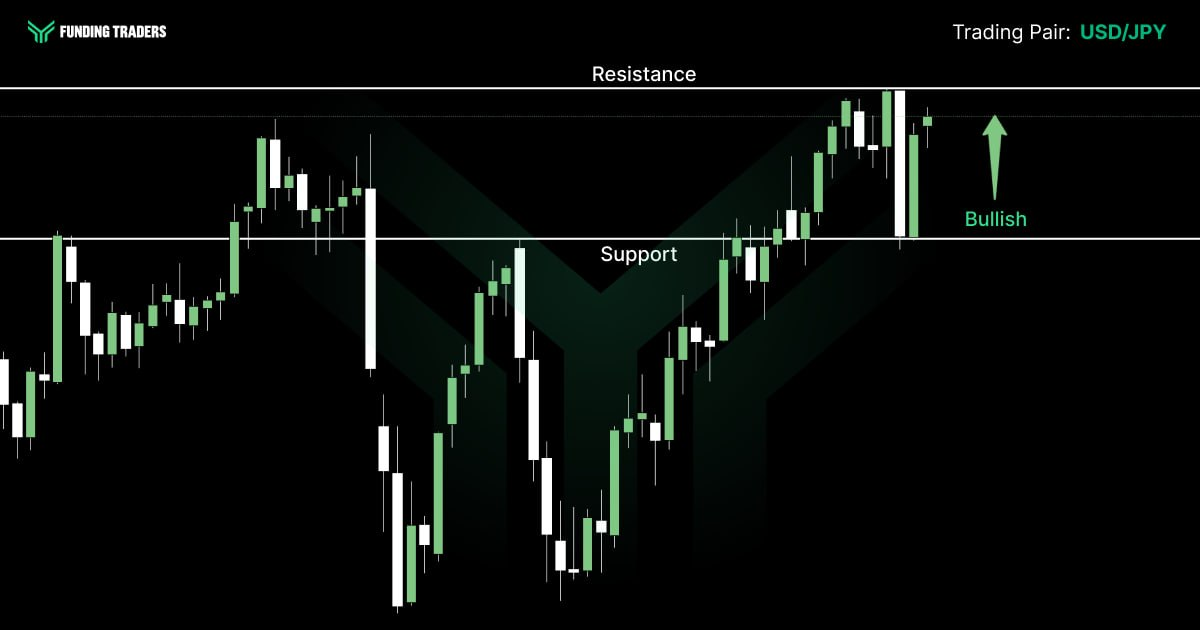
USD/JPY is trading near 159.22, hovering close to its 2026 high of 159.91. The yen remains under sustained pressure as the Bank of Japan continues to signal only slow and cautious rate normalization. While the rest of the world is tightening policy, Japan stands apart, and the market is punishing the yen for it.
The depth of the yen’s weakness is a timely reminder that interest rate differentials remain the dominant force in FX markets. With the Fed holding at 3.75% and the BoJ below 0.75%, the carry trade continues to favor USD/JPY longs. Key levels: support at 157.67; resistance at the 2026 high of 159.91. A break above 160 would likely trigger intervention commentary from Japanese officials, creating a volatile two-way market.
Investors should explore the possibility that a geopolitical de-escalation, however unlikely this week, could trigger a sharp yen rally as safe-haven positions unwind. This project of managing both sides of the trade is where market insights prove most valuable.
USD/CHF and AUD/USD: The Defensive Pair and the Commodity Play
The Swiss franc is trading near record highs against the dollar at approximately 0.7880, driven by relentless safe-haven demand amid the Middle East crisis. The SNB held rates at 0% and is increasingly signaling readiness to intervene to prevent excessive franc appreciation, but market forces are overwhelming the central bank’s verbal efforts. Swiss inflation remains pinned at 0.1%, creating an unusual dynamic where the currency strengthens even as the domestic economy shows minimal price pressure.
AUD/USD sits near 0.7024 after the RBA’s hawkish rate hike to 4.10%. Despite the rate support, the Aussie dollar is weighed down by global risk aversion, falling equity markets, and concerns about the future path of Chinese demand. Australia’s CPI data on Tuesday will be pivotal, expectations point to headline CPI rising to around 3.9% year-over-year. A hot print would reinforce the RBA’s tightening bias and could provide a floor for AUD/USD near 0.6920 support.
Both pairs deliver important perspectives on the current environment: CHF strength reflects pure fear, while AUD weakness reflects the tension between domestic hawkishness and global growth concerns.
WTI Crude Oil: The Macro Epicenter
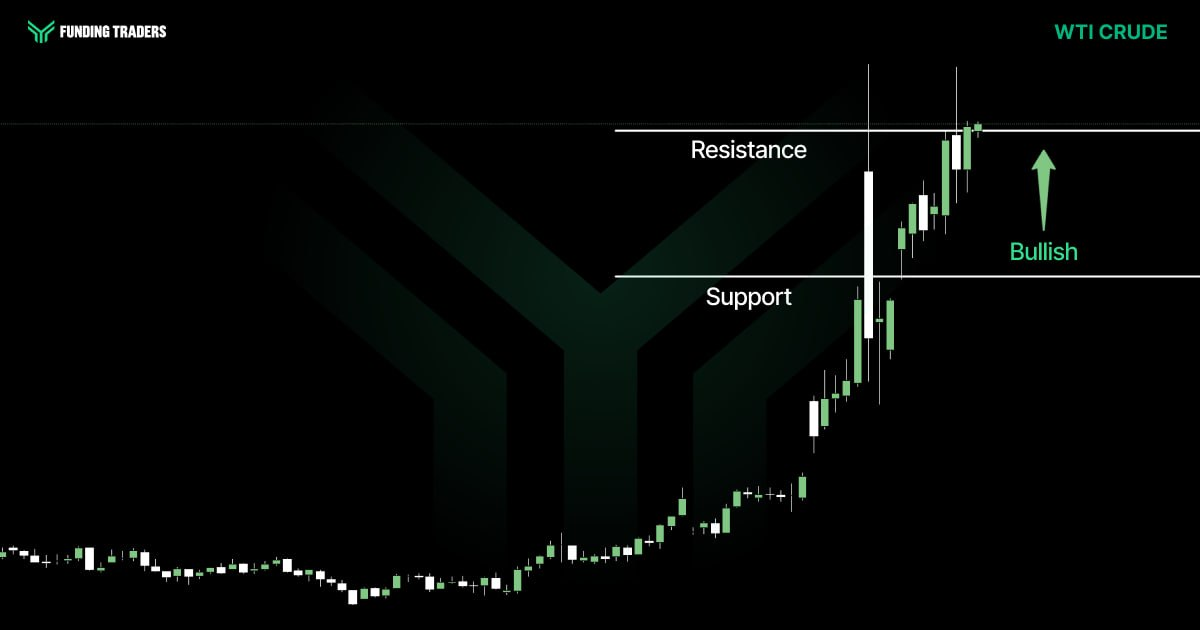
WTI crude oil is trading near $98–100 per barrel, with Brent at roughly $112. Oil is the epicenter of this market cycle, and every other asset class is orbiting around it. The Strait of Hormuz disruption, attacks on Gulf energy infrastructure, and Trump’s weekend ultimatum to Iran have created a supply crisis that shows no signs of easing.
S&P Global’s base case assumes Brent averages $90/bbl in March before moderating back toward $60 by year-end, but that forecast depends on a swift resolution to the conflict, which looks increasingly unlikely. Their severe scenario projects Brent peaking at $200/bbl in Q2, which would tip most major economies into recession. Analysts and leading industry voices, including UBS chief economist Arend Kapteyn, argue that the current energy shock will disproportionately impact consumers because US shale is far less responsive to high prices than it was during the 2011–2014 period.
For traders, crude oil presents both opportunity and danger. The volume is there, the trends are clear, but the risks of gap moves on weekend headlines are extreme. A comprehensive methodology for oil trading this week should include reduced position sizing and wider stops to account for the complex geopolitical landscape.
Navigating crude oil’s explosive volatility requires more than just a view, it requires capital, leverage, and a platform built for serious traders. FundingTraders offers challenges designed for exactly this kind of market environment. With code MADNESS, get 30% off and keep 100% of your profits. Over $5.5 million in total rewards have already been paid out. Join now.
Key Economic Events: March 23–27 (GMT+2)
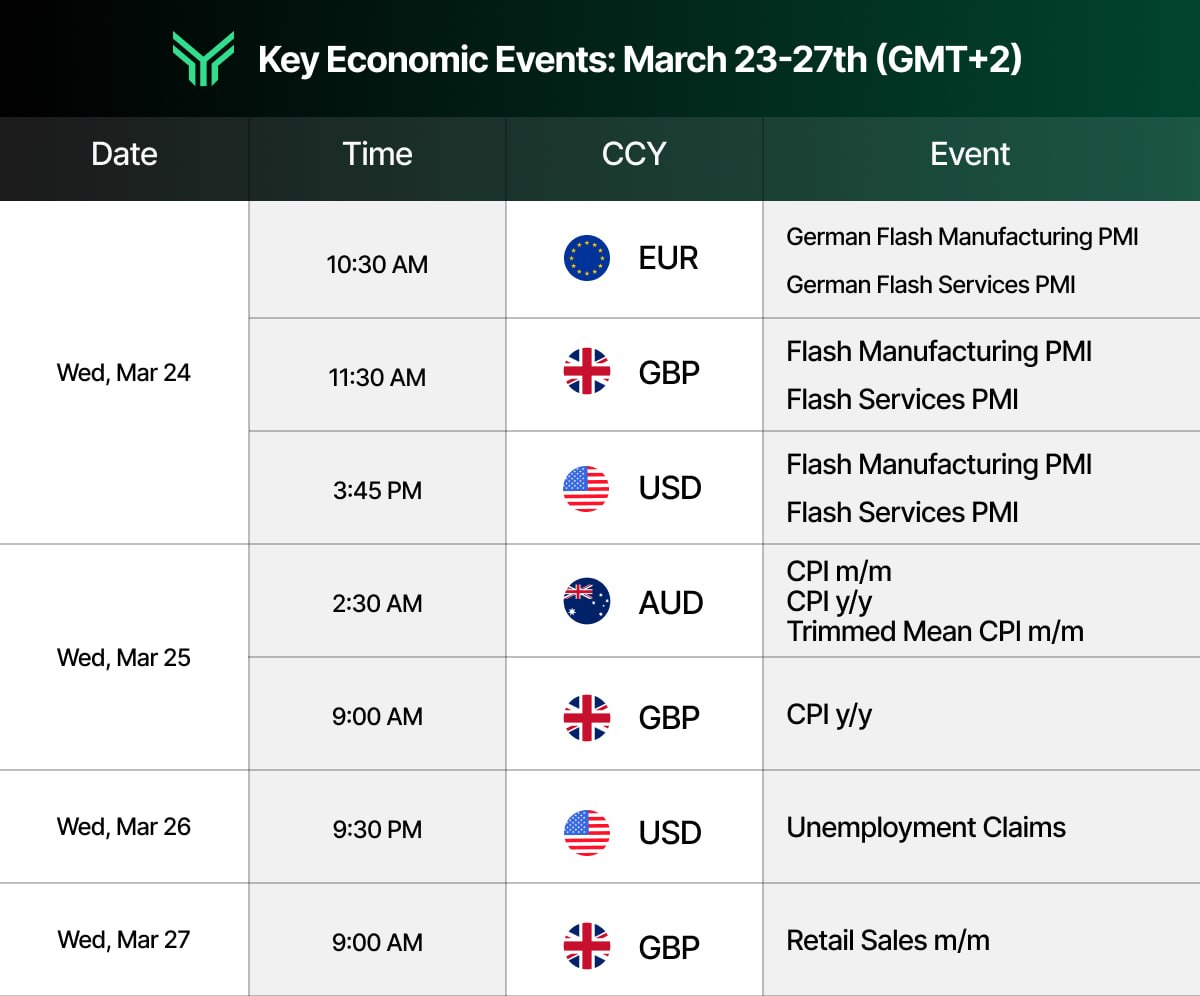
This condensed calendar is adapted from the Forex Factory economic calendar at forexfactory.com, a leading resource professional traders use to track market‑moving macro news and central bank events in real time.
Asset Watchlist: Market Intelligence Snapshot
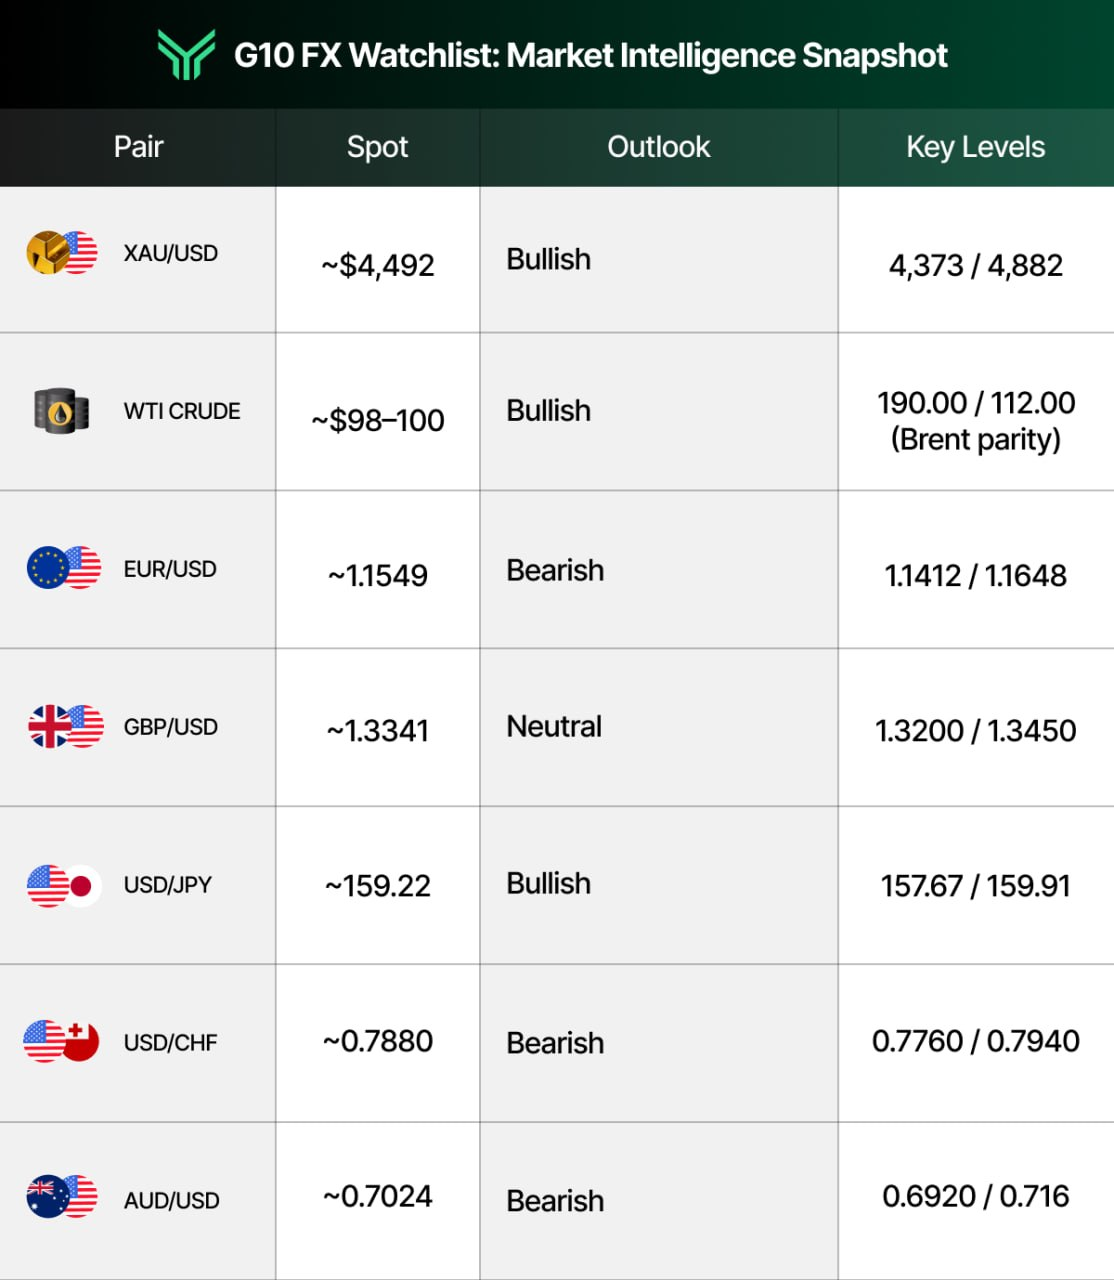
This table delivers market insights at a glance, helping traders quickly analyze key levels and understand current trends.
Actionable Insights for the Week to Drive Growth
Preparation is the trader’s edge, and this week, preparation means understanding the dual-phase market structure that data, geopolitics, and central bank commentary have created.
Phase One Trades (Base Case): The current macro setup favors a defensive posture with selective opportunities. The base case assumes oil remains elevated, the dollar holds its range, and equities grind lower or consolidate. In this scenario:
Long gold on dips toward $4,400 with stops below $4,373. Target: $4,882 and $5,000+.
Short EUR/USD on bounces toward 1.1600–1.1648. Target: 1.1412.
Long USD/JPY on dips toward 158.00. Target: 159.91 and 160+.
Neutral equities: wait for a confirmed hold above the 200-day MA or a flush toward 6,000–6,200 for long entries.
These ideas represent the market insight framework that dedicated traders should implement to gain exposure to the highest-probability setups.
Phase Two Triggers (Scenario Shifts): The following events would fundamentally shift the thesis, requiring rapid adaptation:
De-escalation in the Middle East: Any credible ceasefire or Strait of Hormuz reopening would trigger a violent risk-on squeeze. Oil collapses, gold drops, equities rip, and the dollar sells off. This would require flipping from defensive to aggressive in industry names tied to economic recovery.
Escalation beyond current scope: If the conflict widens further (for example, Saudi infrastructure targeted), oil could spike toward $120–150 WTI, and the market would enter full crisis mode. Gold would surge, equities would crash, and the Fed would face an impossible choice.
UK CPI surprise: A significantly hotter UK CPI print on Wednesday could spike GBP/USD and reprice the entire BoE rate path, creating short-term opportunities in sterling crosses.
This quarterly market update should serve as your playbook. Use these actionable insights to guide businesses and personal trading decisions alike. The future trends point toward continued volatility, and for those with the right training, volatility is where revenues are made.
This is the kind of market where skilled traders separate themselves from the crowd. FundingTraders is offering 30% off every challenge with code MADNESS, plus an industry-leading 100% profit split. Over $5.5M paid out. No limits, no cap. Take the challenge and prove you belong.
Stay Ahead of the Market
This week demands a deep understanding of the forces reshaping global markets. The Iran conflict, the energy shock, and the central bank policy trap are not isolated events, they are interconnected drivers creating a complex macro regime that rewards preparation and punishes complacency. Every piece of data, every headline, and every central bank report will feed into the same question: how long does the crisis last, and what does it mean for inflation, growth, and asset prices across the globe?
At FundingTraders, we believe that market insight is the foundation of every successful trade. Our clients and customers, from seasoned professionals to ambitious newcomers, use our platform to access funded capital and deliver results in exactly this type of environment. The research, the knowledge, and the comprehensive view are here. The confidence to act is up to you.
Disclaimer: This content is for informational and educational purposes only and does not constitute financial, investment, or trading advice. Trading forex and other financial instruments involves significant risk and may not be suitable for all investors. Past performance is not indicative of future results. Always conduct your own research and consult with a licensed financial advisor before making any trading decisions. FundingTraders is a proprietary trading firm and is not a broker-dealer or registered investment advisor.