Every trader hits the same wall eventually. You see a market rip in one direction, you know it can’t last forever, and the temptation to short the high or buy the low becomes impossible to ignore. Most traders who give in to that pull lose money. Not because reversals don’t work, but because they confuse a feeling with a setup.
Done right, reversal trading is one of the best trading strategy options for traders who want bigger reward to risk ratios and the chance to position near major turning points in the financial markets. At FundingTraders, we’ve watched plenty of traders in our funded community build serious results with this approach. The pattern is always the same. The ones who win wait for confirmation. The ones who blow up try to be first.
This guide walks you through how reversal trading actually works in 2026, why it still beats most flashier methods when executed with discipline, and how to apply it inside a prop firm challenge without torching your account. Whether you lean toward day trading, swing trading, or you blend fundamental trading strategies with technical trading strategies and a tight trading plan, the framework here gives you something you can actually use across stocks, forex, crypto, and CFD trading.
Quick Summary Box
In this article you’ll learn the market psychology behind every reversal, how to tell a real turn from a trap, exact entry and exit rules, and how to apply all of it inside a funded trader program. We cover risk tolerance under prop firm rules, position sizing for challenge accounts, and how to combine technical analysis with price action.
If you’ve been hopping between strategies looking for the best trading strategy, reversal trading might be the one you actually stick with. Spot exhaustion. Wait for confirmation. Enter with defined risk. Manage the trade by a fixed plan, not by emotion. Trading strategies are based on probabilities, and reversals shift those probabilities in your favor when you stop guessing and start waiting.
Stop trading on impulse. Build every entry around a plan. Use code FT50 for 50% off any FundingTraders account size, no exceptions. Put this framework to work with real capital and a firm that pays out weekly.
What Reversal Trading Actually Is, And the Market Psychology That Makes It Work
Most trading strategies tell you to join a move that’s already running. Reversal trading flips that on its head. You wait for evidence that the prevailing trend has burned itself out and you position for the new direction as it starts to form.
The logic comes straight from market dynamics and how participants actually behave. Strong trends don’t run forever. When institutional investors start taking profits, when late retail buyers finally pile in at the top, when the news flow turns euphoric, the conditions for a reversal are already in place. Smart money distributes into strength through quiet selling. Buyers run out near tops, sellers run out near bottoms, and the next move has nowhere to go except the other way.
This is why reversal trading has stuck around through every market cycle. It doesn’t depend on a specific financial instrument or a specific person’s prediction. Stocks, forex, commodities, trading CFDs on any liquid asset or security, the principle is the same. Extremes don’t last.
Because you’re entering when most participants are trapped on the wrong side, this trend trading strategy often delivers the best reward to risk ratios you’ll find anywhere in the financial markets. Stops are tight because they sit just past the extreme. Targets are wide because the new move has room. That asymmetry is the whole edge, and it’s what separates this from chasing strong trends after they’ve already extended.
The Key Components of a Reversal Trading Strategy
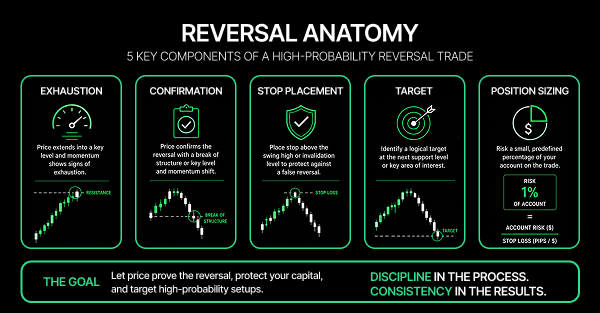
Whether you’re a hedge fund quant running advanced computer modeling techniques or a retail day trader clicking your own orders, the key components stay the same.
Exhaustion identification. RSI extremes, MACD divergence, Bollinger Bands stretched well past two standard deviations, volume climaxes. Overbought or oversold readings alone won’t cut it. You need confluence between price, momentum, and volume, technical indicators that agree on the same story.
Reversal confirmation. Good reversal traders don’t pick tops or bottoms blindly. They wait for a structural signal. A break of the prior swing low. A failed retest of the high. A textbook reversal candle at a key level. Confirmation is what separates a trader from a gambler.
Stop loss placement. Stops sit just beyond the extreme of the pattern. Above the wick of a shooting star. Below the wick of a hammer. The stop has to live where your reversal thesis is genuinely wrong, not where it would be convenient.
Profit target. Most reversal traders take the first target at the next major support and resistance level, then trail the stop as a new trend develops. Trading ratios like 3:1 or 4:1 are common because reversal entries are so precise.
Position sizing. Your risk tolerance and the rules of your trading challenge dictate how much capital you allocate to each trade. Oversized trading positions get shaken out by normal noise before the move plays out. Position sizing is the bridge between strategy and survival, and it directly shapes whether your trading ratios stay intact over a long sample.
Trading plan. None of the above means anything without a written trading plan that defines exactly what you trade, when you trade, how big you trade, and when you walk away. A trading plan is what keeps you from making the call up on the fly when emotions take over and clouds your trading decisions.
Technical Analysis Tools Every Reversal Trader Needs
Technical analysis is the backbone here. Fundamental trading strategies weigh earnings and macro data. Reversal trading runs on price and the indicators that read price structure.
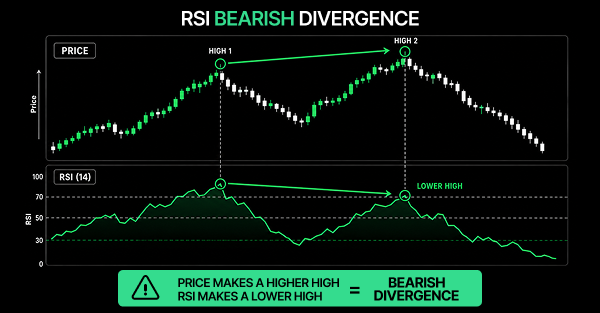
RSI and divergence. Readings above 70 are overbought, below 30 are oversold. The real edge shows up in divergence. Price prints a new high but RSI prints a lower high. Momentum is fading even though the chart still looks bullish.
MACD divergence. Works the same way and pairs well with RSI as a second layer of confirmation. When two independent momentum tools agree the trend is dying, your odds go up.
Bollinger Bands. When price closes well outside a band and snaps back inside on the next candle, that’s one of the cleaner mean reversion signals available. Bands also show volatility at a glance.
Volume analysis. A reversal without a volume spike is suspect. Climax volume at tops and bottoms shows the final buyers or sellers got absorbed. On balance volume confirms the new direction is gaining real participation.
Some traders stack on Stochastic or Williams %R. Honestly, more isn’t better. Indicators that say the same thing twice just create false confidence. Keep the chart clean.
If you also lean on fundamental analysis, surprise earnings, central bank decisions, and unexpected macro data often act as the trigger that converts an exhausted trend into a confirmed reversal.
Price Action and Support and Resistance: Reading the Reversal Without Clutter
Price action is the raw language of the market. Traders who can read it without leaning on oscillators have an edge no indicator replaces.
At a real top, you’ll see long upper wicks, shrinking bullish candle bodies, failed breakout attempts, and aggressive rejection from the same price zone. At a real bottom, the mirror image. Long lower wicks, capitulation candles followed by absorption, buying that won’t let price stay down. These signatures show up before any indicator confirms the change.
The cleanest reversal setups form where multiple factors line up. A prior resistance level that has held twice already. A 78.6% Fibonacci extension. Bearish RSI divergence. All meeting at the same price. When price hits that zone and prints a textbook reversal candle, that’s your entry signal.
Support and resistance levels are the map. Major weekly and monthly levels are where institutional investors place orders, and those zones are where trends most often die. Resistance levels above current price are where supply concentrates, and breaking them needs fresh buying that may not exist after a long trend.
Chart patterns like double tops, double bottoms, head and shoulders, and rising or falling wedges signal a structural change. When confirmed by a neckline break on volume, you get a textbook entry with a clearly defined invalidation point.
Entry Rules, Stop Loss Logic, and the Trading Ratios That Keep You in the Game
Plenty of traders correctly call a top or bottom and still lose money. Their entries are early, their stops are sloppy, and their trading ratios don’t survive prop firm rules.
Entry rules. Identify trend exhaustion on a higher timeframe using divergence and structure. Wait for price to reach a major support and resistance level. Wait for a confirmation candle. Engulfing pattern, pin bar, or close back inside a Bollinger Band. Enter on the close of that candle or on the break of its high or low.
Stop loss logic. Place your stop just beyond the extreme of the pattern. Above the high for shorts, below the low for longs. Stops inside the pattern get hit by normal noise. Stops too far away wreck your trading ratios.
Profit targets. Reversal trades often deliver 3:1 or 4:1 because entries are so close to the invalidation point. First target at the next significant support and resistance level. Take partial profit. Trail the stop on the runner. You lock in profit while keeping room for a more profitable return if the move extends.
A reversal strategy doesn’t need a high win rate. Plenty of successful reversal traders win only 35 to 45% of their trades, but their winners are three to four times their losers. Track your trading ratios after every session and let the data, not your gut, guide your trading decisions.
Why Most Traders Blow the Challenge on Risk Tolerance, Not Bad Entries
Here’s where most funded account attempts die. The analysis is right. The reversal level is real. But the trader enters three times before the actual turn shows up and burns through the risk budget.
Risk management inside a prop firm challenge runs on hard limits. Maximum daily loss. Maximum total drawdown. Profit targets with deadlines. Your risk tolerance has to match those rules.
Risk per trade. Never risk more than 1% per trade. Reversal trading rewards small risk because you might need two or three tries at the same level before the real turn confirms. At 1% risk, you can absorb several failed attempts without breaching your daily limit.
Avoiding premature entries. Divergence is not an entry signal. It’s a warning. Wait for structure to break in your favor. The traders who wait for the confirmation candle are the ones who survive.
Correlation risk. Shorting two indices that move together at the same time doubles your exposure. Manage correlation like it matters, because it does.
Emotional risk. After two stopped out attempts at the same level, sizing up on the third try feels like the right call. It almost never is. Write your rules in advance. Define your maximum attempts per level and your stop for the day threshold. A fixed plan removes decisions when emotions are highest.
A disciplined plan deserves a firm that backs it. FundingTraders delivers weekly payouts, profit splits up to 100%, and no penalties for event-driven setups. Apply code FT50 at checkout for 50% off any account size and trade your edge without the usual prop-firm friction.
Day Trading vs. Swing Trading: Matching Your Style to Reversal Trading
Your trading style determines how you apply the strategy.
Day trading. Day traders execute entirely within one session and close everything before market close. No trade held overnight. Day trading reversals works for traders who want to capture intraday extremes around session opens and big news releases. The best trading opportunities show up at the London open, New York open, and the first hour after major data releases.
Swing trading. Swing traders hold for days or weeks on four hour, daily, and weekly charts. Positions are held overnight. Wider stops, fewer trades, but a single swing reversal can deliver 10:1 or better if you catch the top and ride the new trend.
Both work for challenges. Day trading avoids gap risk because nothing is held overnight. Swing trading captures the meat of major turns but adds overnight uncertainty. A lot of traders blend the two. Use daily charts to find the reversal zone, drop to four hour or one hour to time the entry.
From Demo Account to Funded Trader: The Progression That Actually Works
A demo account gives you a risk free environment to test your reversal system and build the patience this strategy demands. Most traders skip straight from demo to a funded challenge with nothing in between. Reversal trading punishes that shortcut.
Phase 1: Demo account mastery. Trade on a demo account for four to six weeks. Log every setup, including the ones you skipped. Can you wait for confirmation? Can you avoid early entries? A demo account with virtual funds is where you make those mistakes for free.
Phase 2: Small live account. Before a full challenge, trade the lowest tier you can. The emotional gap between virtual funds and real money is huge.
Phase 3: Full challenge. Once you’ve shown consistency over 30 or more trades with positive expectancy, you’re ready. Strategy validated, risk rules locked in, and the challenge becomes a process rather than a roll of the dice.
Backtesting, Journaling, and the Metrics That Predict Funded Account Success
You can’t improve what you don’t measure. The gap between traders who ensure consistent results and traders who blow accounts is almost always data.
Backtesting. Test your strategy across at least 100 historical setups using TradingView’s replay feature. Record entry, stop, target, outcome. Pay close attention to how many losing trades cluster before a winner, because reversal trading often runs in streaks.
Journaling. Every trade gets logged. Setup, divergence signals, confirmation candle, exit reason, emotional state, chart screenshot. Patterns show up over time that turn gut feel into hard data.
Key metrics. Win rate (35 to 50% typically). Profit factor (above 1.5 is solid, above 2.0 is excellent). Maximum consecutive losses, which matters more here because you need to size for the longest losing streak you can survive.
Track weekly. If expectancy is negative, back to backtesting. Consistent results come from consistent process.
Practical Examples: Wins, Losses, and What the Market Looks Like
Example 1: GBPUSD swing reversal win. March 2026, GBPUSD had rallied for three weeks into major weekly resistance at 1.3120. Daily RSI printed clear bearish divergence as price made a marginal new high. A bearish engulfing candle closed below the prior daily low. Short at 1.3085, stop at 1.3135 (50 pips above the high), target at 1.2935 (150 pips, 3:1). Price rolled over and hit target within five sessions.
Example 2: Nasdaq 100 CFD day trade reversal win. After a strong morning rally, Nasdaq 100 pushed into prior day resistance at 21,680 with 15 minute RSI at 78 and shrinking candle bodies. A bearish pin bar formed with a long upper wick. Short at 21,640, stop at 21,700, target at 21,520 (2:1). Hit within ninety minutes. No position held overnight.
Example 3: Crude oil reversal loss. Crude oil had sold off into major monthly support at $68.40. A bullish hammer formed with strong volume and RSI divergence on the four hour chart. Long at $68.85, stop at $68.10. Two days later a surprise OPEC announcement pushed price below the prior low and took out the stop at $68.05. Loss of 1% of the account. Even with a valid setup, outside catalysts can override the technical picture. The account survived because position sizing was correct. The next clean setup paid for it.
Conclusion
Reversal trading has stuck around for decades because it works. It doesn’t ask you to chase moves that have already happened. It asks for patience, precision, and the discipline to wait for confirmation instead of guessing. The best trading strategy is the one you can actually execute consistently, and reversal trading rewards traders who treat every entry as a calculated decision rather than a hunch.
At FundingTraders we’ve built a platform and community designed to enable traders to move from preparation to execution. Over $5.5M in total rewards paid out is proof this is a real path for traders who are ready to commit. The market rewards preparation. Your funded account is waiting.
You’ve built the edge. Now put capital behind it. Use code FT50 for 50% off every FundingTraders challenge, from $10K to $200K, same discount and same weekly payout schedule across the board. Keep what you earn, scale every three months, and join the $5.5M+ already paid out to traders like you.
Disclaimer: Trading involves significant risk and is not suitable for every investor. Past performance is not indicative of future results. The information provided in this article is for educational and informational purposes only and should not be considered financial, investment, or trading advice. All account rules, payout structures, profit splits, and promotional offers described in this article are subject to change at the discretion of FundingTraders. Promo codes may expire or be modified without prior notice. Always trade responsibly and only risk what you can afford to lose.