Market insights this week begin with one unavoidable reality: the Iran conflict is now entering its fifth week, and every asset class on the globe is repricing around energy risk, inflation fear, and a Federal Reserve trapped between hawkish data and a slowing economy. As global markets digest another brutal stretch for equities and a continued surge in crude oil, traders need timely, actionable insights grounded in real data to navigate what may be the most complex macro environment since 2022. This quarterly market update arrives at a critical inflection point, with nonfarm payrolls dropping on Good Friday to close markets, ISM manufacturing data mid-week, and Eurozone inflation figures that will reveal just how deeply the oil shock has penetrated consumers across multiple geographies. Whether you are looking to analyze risk in equities, explore opportunities in commodities, or implement defensive currency plays, this report delivers the market research and depth you need.
Quick Summary Box
Week of March 30 – April 3, 2026: Risk-off dominance continues as the Iran war, surging oil prices, and sticky inflation data keep investors on edge, and this market intelligence snapshot captures the full picture. Gold (XAUUSD) is trading near $4,450–$4,510 after a sharp 13% correction from its January all-time high of $5,595, with liquidity pressure and a stronger dollar limiting safe-haven gains despite elevated geopolitical risks, while support holds near $4,100 and resistance sits at $4,700–$4,870. WTI Crude Oil hovers between $92 and $102 per barrel as Strait of Hormuz disruptions and Goldman Sachs’ raised Brent forecast to $110/bbl keep the bullish bias intact, with the $100 level remaining the key psychological threshold. On the equities side, the S&P 500 closed Friday at approximately 6,369, a fifth consecutive weekly loss, leaving the index roughly 9% off its January high of 7,002, and JPMorgan sees downside risk to 5,400 in a severe oil shock scenario. Meanwhile, the DXY (US Dollar Index) remains firm near 100.20, gaining strength from inflation repricing and safe-haven demand as global markets sell off. For businesses and clients tracking global markets, this week’s data releases, especially NFP on Friday and ISM on Wednesday, will determine the direction for April, and the path chosen here will inform trading strategies for the entire second quarter.
Asset Breakdown: Market Research on Global Markets
XAUUSD (Gold): Safe Haven Under Pressure
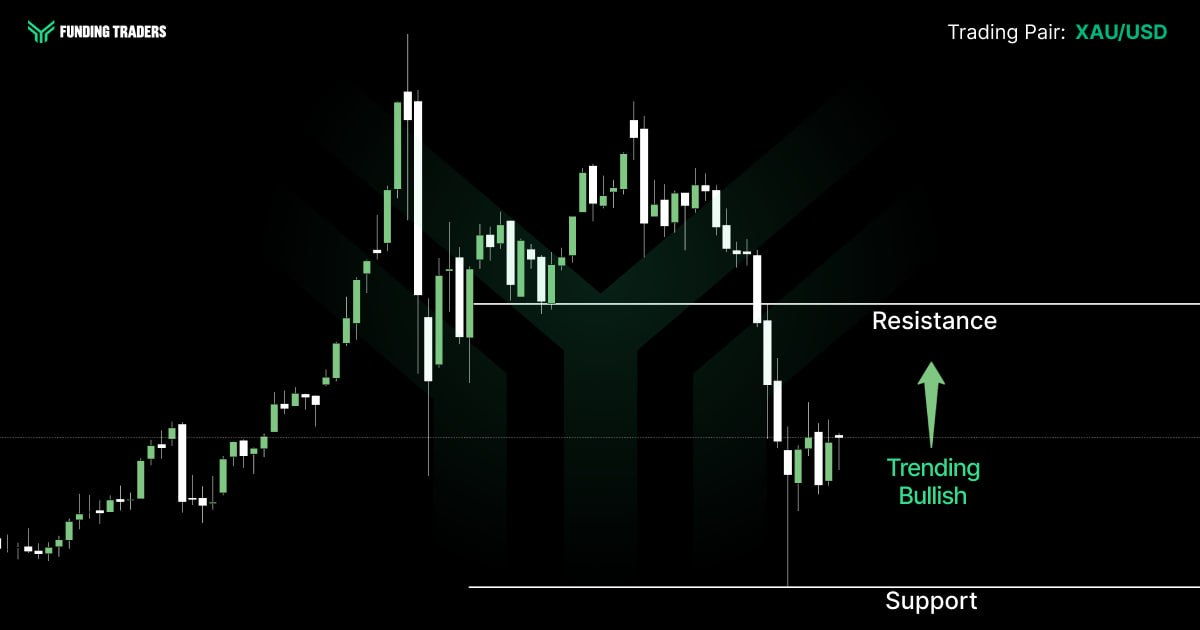
Gold continues to confound expectations. Despite an active war in the Middle East, XAUUSD has pulled back roughly 13% from its all-time high of $5,595 set on January 29. The metal closed last week near $4,508, with a weekly range between $4,104 and $4,602, extraordinary volume and volatility highlighting the complex forces at work.
Three drivers weigh on bullion: rising real yields as the market prices out Fed cuts, a liquidity squeeze as investors sell gold to cover equity margin calls, and dollar strength reducing gold’s appeal for international customers. Analysts at one leading broker flagged the potential for a decline toward $3,700, while the consensus forecast from research houses projects a recovery toward $5,100–$5,500 by year-end.
The $4,100 zone is critical support. Resistance sits near $4,700 and $4,870, where institutional sellers are dedicated and active. The bias is cautiously bullish medium-term, but near-term risks tilt lower. Traders should focus on JOLTS data and Powell’s commentary on Tuesday for clues on the rate-cut narrative.
If you are looking to capitalize on gold’s volatility this week, FundingTraders gives you the capital and the platform to project your ideas into live market conditions. Trade gold, oil, and major forex pairs with up to $200,000 in funded capital. Use code FT50 at checkout to unlock a massive 50% discount, which is half the price for full access to one of the industry’s leading prop trading challenges. Start your funded journey now.
EUR/USD: Europe’s Energy Weaknesses Exposed
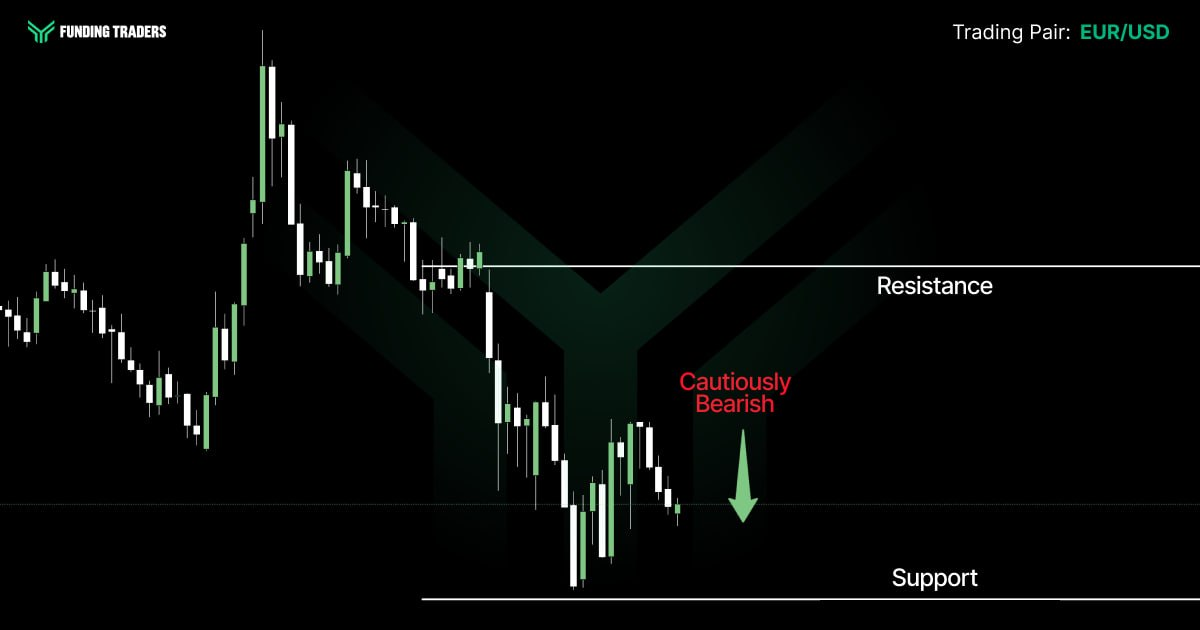
EUR/USD has retreated to approximately 1.16, surrendering its early-2026 gains as the Middle East conflict exposed Europe’s acute energy dependence. The euro area’s reliance on imported energy, particularly natural gas and refined petroleum, means rising oil prices act as a direct tax on economic growth across the bloc. Eurozone flash CPI data on Tuesday is expected to print at 2.5%, which will reveal the initial pass-through of the oil shock into consumer prices.
The ECB held its rate at 2.00% at its March 19 meeting and now faces a difficult balancing act: inflation is rising due to supply-side factors while growth is weakening. This is the textbook definition of a stagflationary environment, and it limits the central bank’s ability to deliver the easing that businesses and consumers were expecting. Research from MUFG indicates the euro could recover later in the year if tensions ease, but the near-term outlook favors continued weakness toward 1.14.
Key support for EUR/USD sits near 1.14–1.15, while resistance is at 1.19, the level it fell from in March. Traders should analyze the gap between headline and core CPI on Tuesday; a wide divergence would support the idea that the ECB will “look through” the inflation spike, while a narrow gap would signal more persistent price pressures.
GBP/JPY: Riding the Carry Wave Into Intervention Risk
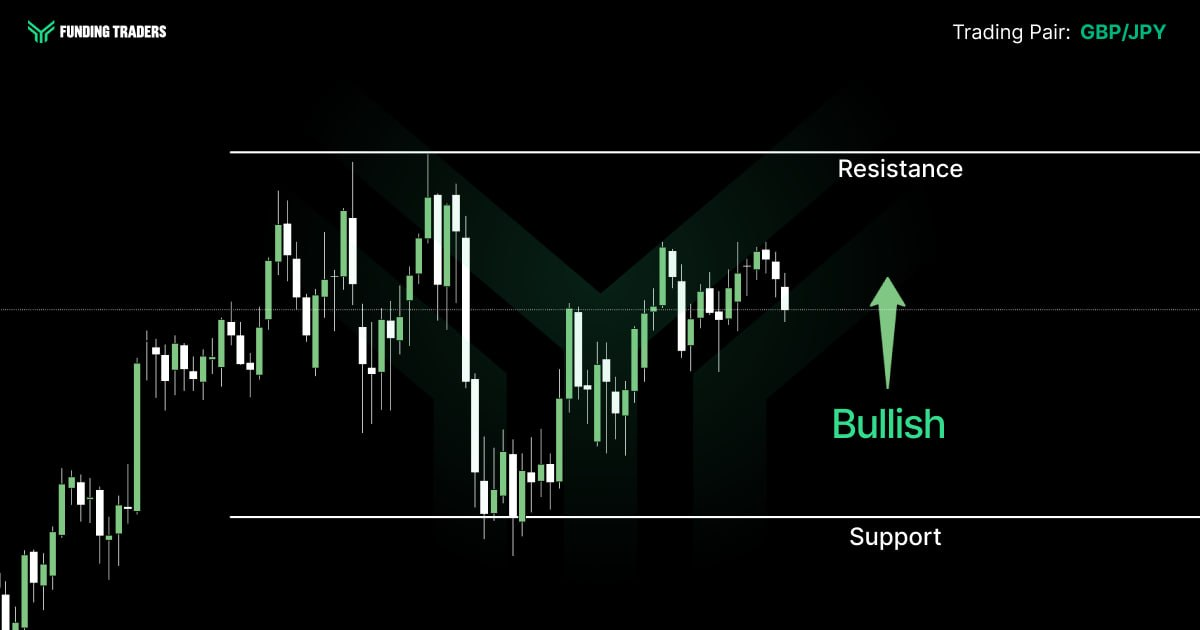
GBP/JPY is trading near 212.60, holding a bullish formation after surging from a 52-week low of 184.36 to test highs above 213.00 earlier this month. The pair is one of the most active expressions of yen weakness right now, driven by the strong correlation between rising oil prices and Japan’s ballooning energy import bill. With the UK economy showing more resilience than the eurozone and the Bank of England maintaining a cautious stance, sterling has become a preferred vehicle for capturing yen-side momentum.
However, GBP/JPY carries a layer of risk that traders cannot ignore. The pair’s trajectory is tightly linked to USD/JPY, which is flirting with the 160.00 intervention line. If the Bank of Japan moves to defend the yen, whether through verbal warnings or direct action, the resulting yen strength would hit GBP/JPY hard. Institutional commentary from Forex.com highlights a bull pennant pattern on the pair, but a breakout requires USD/JPY to hold below 160 without triggering official intervention.
Key support sits at 209.00–210.00, with a deeper floor near 205.00. Resistance is at 213.30, the recent supply zone, and the 52-week high of 215.05. The directional bias remains bullish on rate differentials and carry, but position sizing should account for the binary intervention risk. Watch the BoJ Summary of Opinions on Monday and the Tankan survey on Wednesday for signals that could shift the yen outlook rapidly.
USD/JPY: The 160 Intervention Line Looms
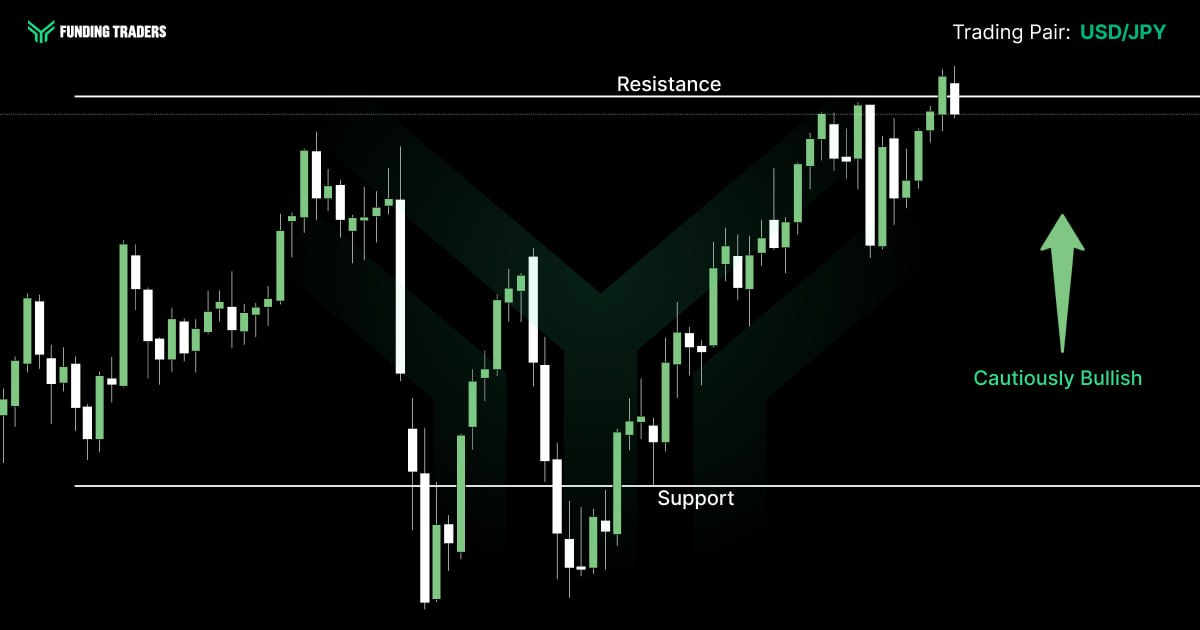
USD/JPY continues to flirt with the 160.00 level, a major line in the sand that has twice provoked Japanese government intervention. The pair closed last week near 158.64, driven higher by the strong correlation between oil prices and yen weakness. Japan’s energy import bill has ballooned due to the conflict, widening the trade deficit and pressuring the currency.
The Bank of Japan hiked rates to 0.75% in December and is widely expected to stay on hold for now. The BoJ’s Summary of Opinions (Monday) and March Tankan survey (Wednesday) will be closely watched for signals of how the war is impacting business sentiment among Japanese manufacturers. If USD/JPY breaks convincingly above 160, intervention risk is elevated, and a replay of 2024’s dramatic yen reversal cannot be ruled out. Predictions from several analysts suggest the BoJ may use verbal warnings before deploying actual reserves, creating a volatile environment around this level.
Key levels: support at 156.00 and 154.00; resistance at 159.50 and 160.00. The directional bias is bullish for USD/JPY on rate differentials, but the intervention risk creates a ceiling that smart traders must respect.
USD/CHF and AUD/USD: Defensive Flows and Commodity Sensitivity
USD/CHF has been slipping as the Swiss franc attracts safe-haven capital. The pair is trading below the 0.92 level, reflecting investor preference for the franc during periods of elevated geopolitical risk. The SNB’s intervention risks provide a floor, but the trend favors continued franc strength unless the war de-escalates.
AUD/USD dropped to around 0.697, weighed down by risk-off sentiment and China’s slowing services sector. The RBA recently raised rates to 3.85%, but the Australian dollar remains sensitive to global growth expectations and commodity demand. China’s Caixin Manufacturing PMI (Wednesday) is a critical data point; any deceleration will add further pressure to the Aussie. Support is near 0.6900; resistance is at 0.7100.
WTI Crude Oil: The Macro Epicenter
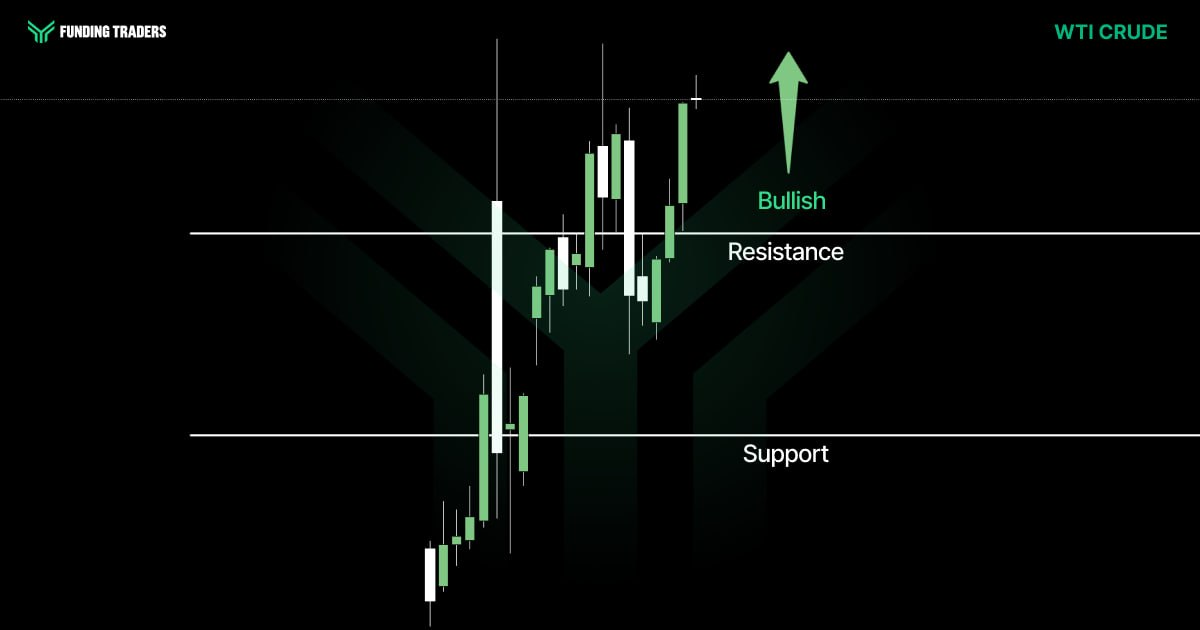
If there is one chart that defines this market cycle, it is crude oil. WTI has surged approximately 39% year-to-date, trading between $92 and $102 per barrel entering this week. The conflict-driven supply disruption fears, centered on the Strait of Hormuz, have embedded a massive risk premium into energy prices. Goldman Sachs raised its 2026 Brent average forecast to $110/bbl, and the EIA has similarly revised its outlook higher.
The $100 level on WTI is the critical threshold. A sustained break above $100 would deepen inflation concerns, push the Fed further from rate cuts, and accelerate the equity sell-off. Conversely, any credible diplomatic breakthrough, particularly around the April 6 deadline for the pause on strikes, could trigger a sharp reversal in oil and send equities surging. Wednesday’s EIA petroleum inventory report will provide fresh data on supply conditions and demand.
The trading environment for oil is characterized by extreme positioning divergence. Speculative traders hold their most bullish net-long position since 2020, while producers are actively hedging at current elevated levels. This creates conditions for sharp, violent moves in either direction, a setup that rewards disciplined, well-capitalized traders.
Volatile oil markets reward prepared traders. FundingTraders offers funded accounts up to $200,000 so you can trade WTI, Brent, and energy-related pairs without risking your own capital. This is your chance to gain an edge and deliver results in a market that’s moving fast. Use code FT50 for a 50% discount, the best deal available this month.
Key Economic Events: March 30 – April 3(GMT+3)
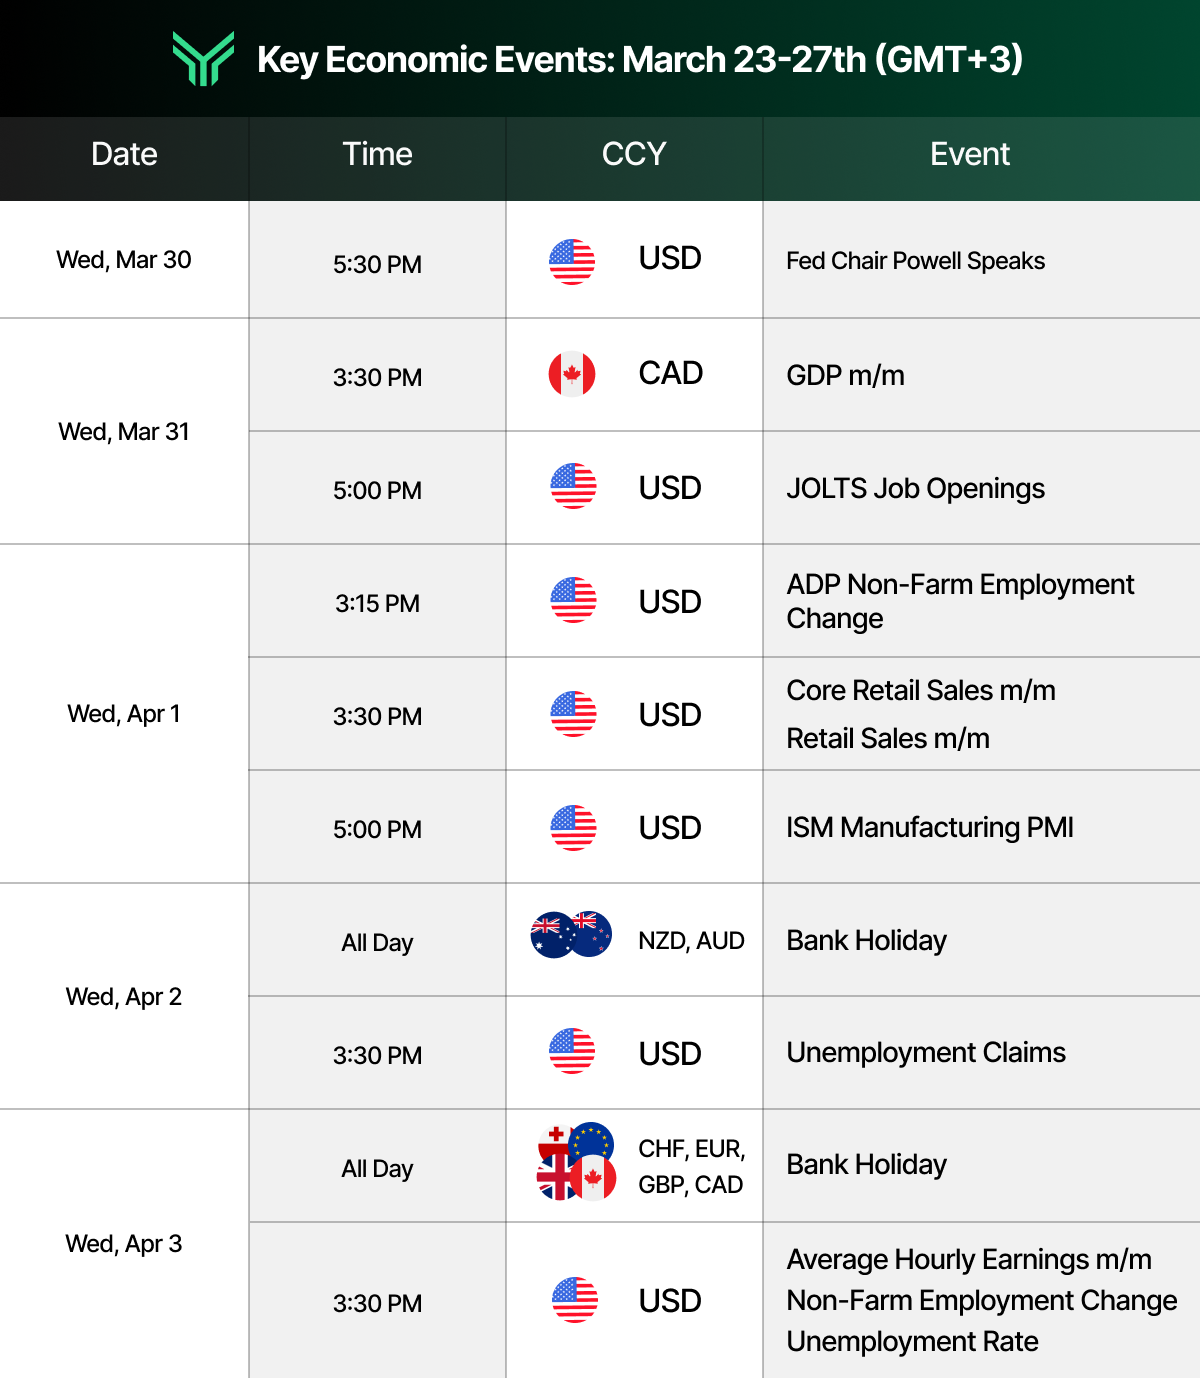
This condensed calendar is adapted from the Forex Factory economic calendar at forexfactory.com, a leading resource professional traders use to track market‑moving macro news and central bank events in real time.
Asset Watchlist: Market Intelligence Snapshot
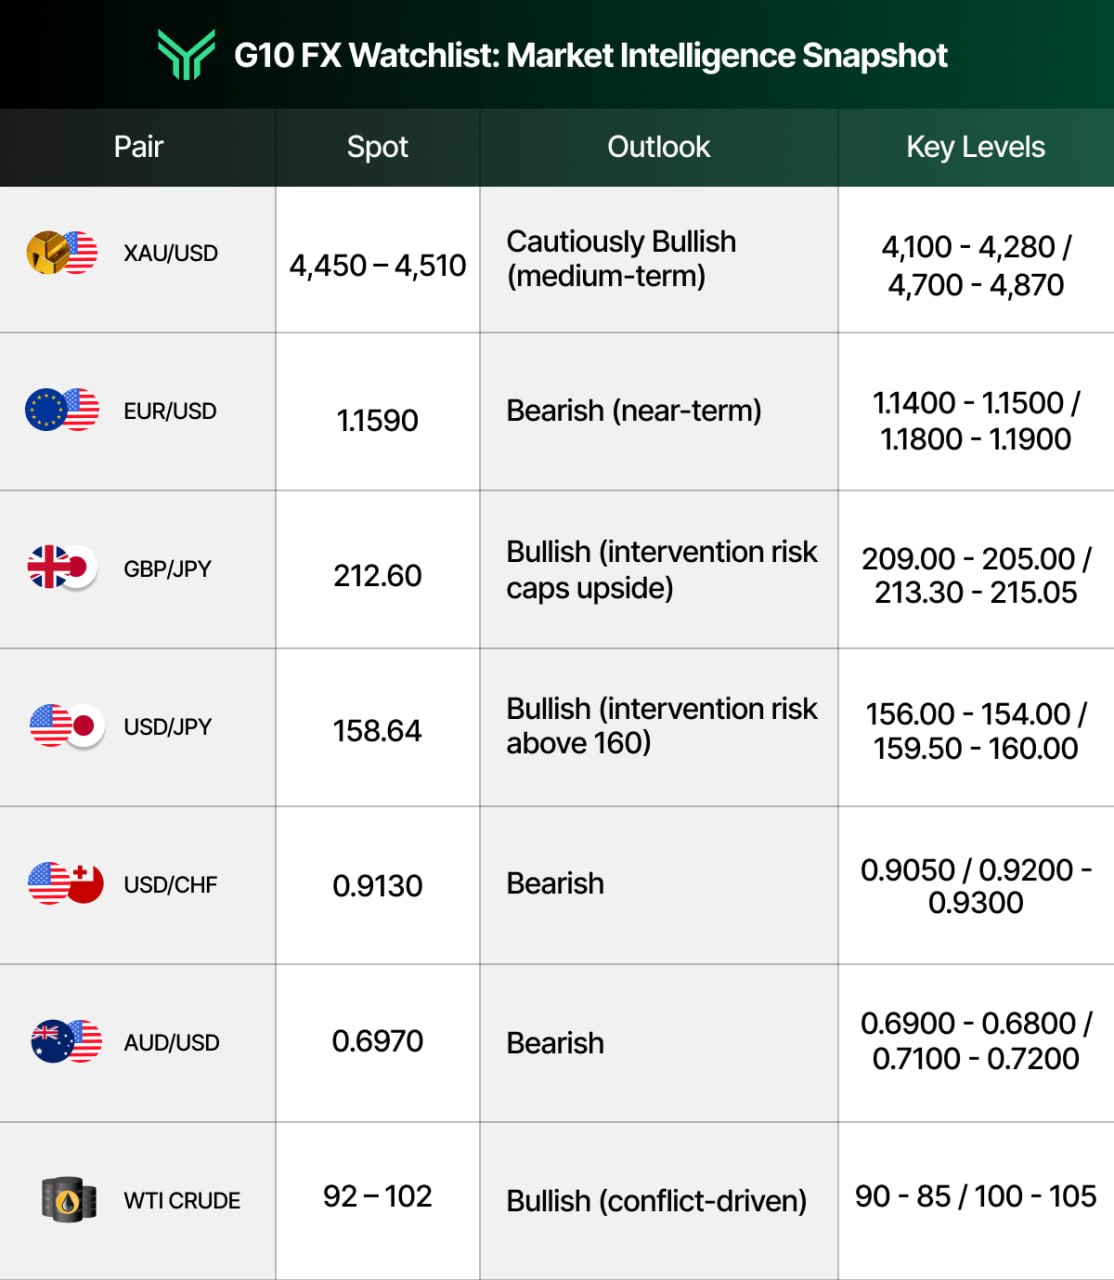
This table delivers market insights at a glance, helping traders quickly analyze key levels and understand current trends.
Actionable Insights for the Week to Drive Growth
Preparation is the trader’s edge, and this week demands it more than most. The overlap of a shortened trading week (Easter holidays), a major employment report dropping to closed markets, and an active military conflict creates a layered risk environment. Here is how to approach it.
Phase One, Base Case Trades:
The base case assumes the Iran conflict remains contained without escalation beyond current levels and that the April 6 deadline passes without a resumption of strikes on energy infrastructure. In this scenario:
Long WTI Crude on dips toward $90–$92 with a target of $100–$105. The geopolitical risk premium remains intact, and any inventory drawdown data on Wednesday would support this trade.
Short EUR/USD on rallies toward 1.17–1.18, targeting 1.14–1.15. Europe’s energy weaknesses are structural, and a higher-than-expected CPI print on Tuesday would reinforce the stagflation narrative.
Cautious long gold on a test of $4,100–$4,200 with a target of $4,500. The sell-off has been aggressive, and value buyers are likely to emerge at these levels. Use a stop below $4,000.
Reduce S&P 500 long exposure and consider hedging with VIX calls or put spreads. The trend is your friend until it bends, and the trend here remains firmly lower.
Phase Two, Event Triggers That Change the Thesis:
Diplomatic breakthrough on Iran: A credible peace deal or de-escalation would collapse the oil risk premium by $15–$25/bbl within days. This would be massively bullish for equities and EUR/USD, and bearish for gold and the dollar. Monitor headlines around the April 6 deadline closely.
NFP surprise (either direction): A second consecutive negative payrolls print would dramatically shift rate expectations and could trigger a risk-off cascade. A strong print above +150K would settle recession fears and potentially spark a short-covering rally. Note that the full market reaction is deferred to Monday, April 6, creating a 72-hour gap of unresolved position risk.
Powell commentary shift: If Powell signals willingness to hike rates in response to oil-driven inflation, expect a sharp dollar rally and further equity weakness. If he reaffirms a “look through” stance, risk assets could find temporary relief.
Traders should use this week’s data to build knowledge about the macro regime and refine their positioning for April. The best opportunities emerge from patience, a deep understanding of the data, and the confidence to act when the edge presents itself. Innovative tools such as AI-driven market analysis platforms and generative AI commentary services can help traders process the high volume of information available across different perspectives and geographies.
This is the kind of market where funded traders thrive. With FundingTraders, you access up to $200,000 in trading capital, dedicated support from an organization that understands what traders need, and a training process designed to build real skill. Your team at FundingTraders is committed to helping clients at every stage, from their first challenge to consistent profitability. Don’t wait for the market to tell you what you already know: opportunity is here. Use code FT50 to get a 50% discount on your challenge, the biggest savings of the month. Visit FundingTraders and take the next step.
Stay Ahead of the Market
This week’s market insights paint a clear picture: we are operating in a wartime macro regime where oil prices, inflation expectations, and central bank policy are locked in a feedback loop. The Iran conflict’s trajectory will continue to be the single most important variable across global markets, from the direction of WTI crude to the fate of the S&P 500’s support levels. Every data release this week will be filtered through the lens of energy risk and its downstream effects on the economy, consumers, and corporate revenues.
For traders, the priority is clarity. Build your trade ideas around the Phase One and Phase Two frameworks outlined above. Identify your key levels, define your risk, and let the data and the market tell you when to act. The report this week shows that quality opportunities exist in every asset class, from currencies to commodities to equities, for those with the knowledge, the brand of discipline that separates consistent traders from the crowd, and access to capital.
Disclaimer: Trading involves significant risk and is not suitable for every investor. Past performance is not indicative of future results. The information provided in this article is for educational and informational purposes only and should not be considered financial, investment, or trading advice. All account rules, payout structures, profit splits, and promotional offers described in this article are subject to change at the discretion of FundingTraders. Promo codes may expire or be modified without prior notice. Always trade responsibly and only risk what you can afford to lose.