Welcome to this week’s Market Insights, where the story isn’t a single headline, it’s a handover. The Federal Reserve has a new chair, the outgoing one speaks on Monday, and a closely watched jobs report lands on Friday, all while a fragile Middle East ceasefire keeps energy prices on edge. Our market research this week pulls the global markets picture together so you can see how a more hawkish central bank, cooling oil, and steady economic growth are tugging in different directions. Here’s what the data is really saying, and where the actionable insights for traders are hiding.
Quick Summary Box
The mood entering the week is cautious calm: quiet on the surface, busy underneath. Gold has eased from its recent peak as war fears soften, yet steady central-bank buying keeps a floor under it, so eyes turn to how the new Fed chief sounds. Crude oil is the big mover, sliding on ceasefire hopes, though the Strait of Hormuz is still the wildcard that could flip the trends overnight. US equities sit near record highs on artificial-intelligence optimism, but June is historically soft, and Friday’s payrolls could test that confidence. The dollar is firm, quietly supported by a more hawkish Fed, and that strength is the swing factor for everything else, from a euro waiting on its central bank to a yen pinned near levels that invite intervention. In short: a week where preparation matters more than prediction.
Asset Breakdown: Market Research on Global Markets
This section turns the macro narrative into a tradeable view. Each asset is framed with a directional focus, the levels that matter, and the events that could reveal which side wins.
XAUUSD (Gold)
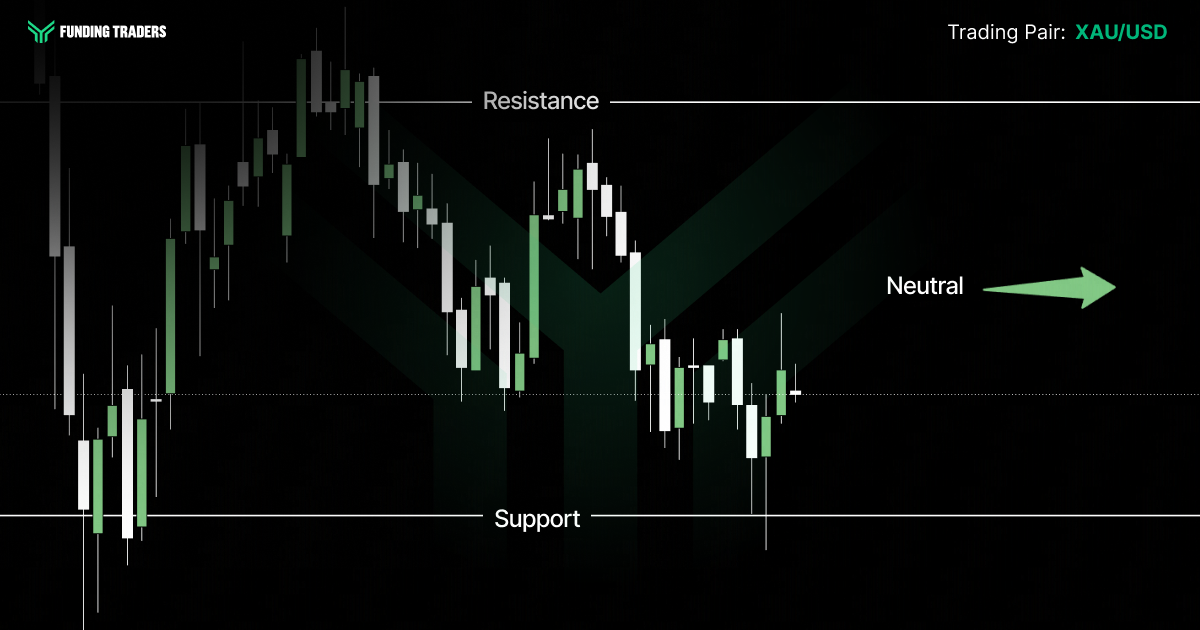
Gold spent the back half of May cooling off, slipping from the vicinity of $4,600 to hold defensively just above $4,500 as traders priced in a calmer Middle East. That’s the near-term tension in one line: the safe-haven premium that drove the metal to its earlier highs is leaking out as a ceasefire firms up, while the structural story stays intact.
The bigger weight right now is the dollar. With a more hawkish Fed and live bets on rates staying high, even a small chance of a hike later this year, the opportunity cost of holding a non-yielding asset rises, and that caps gold’s upside. Monday’s remarks from the outgoing chair are the first thing to watch; any hint of openness to easing later in 2026 could give bullion a quick lift, while a patient, hawkish tone reinforces the ceiling.
Underneath the noise, the floor is real. Analysts keep pointing to relentless central-bank demand and de-dollarization as the long-run engine, with the World Gold Council and J.P. Morgan both projecting heavy official buying through 2026. The forecast range is wide but constructive: Goldman Sachs near $4,900 (upside past $5,000), J.P. Morgan ~$5,055 by Q4, and UBS at $5,900 year-end while flagging a $4,600 downside if the Fed leans harder. Net read: neutral-to-soft tactically, with $4,480 and $4,400 the support levels that matter and Friday’s payrolls likely to set the tone.
Gold lives and dies by the next headline, Powell on Monday, payrolls on Friday, and most firms hand you a rulebook that benches you for exactly those moves. FundingTraders lets you trade the news without restrictions, so you can act on a setup the moment it prints. Start your evaluation today and use code FT50 for 50% off any account from $5K to $200K, half-price funding, full-size opportunity.
EUR/USD
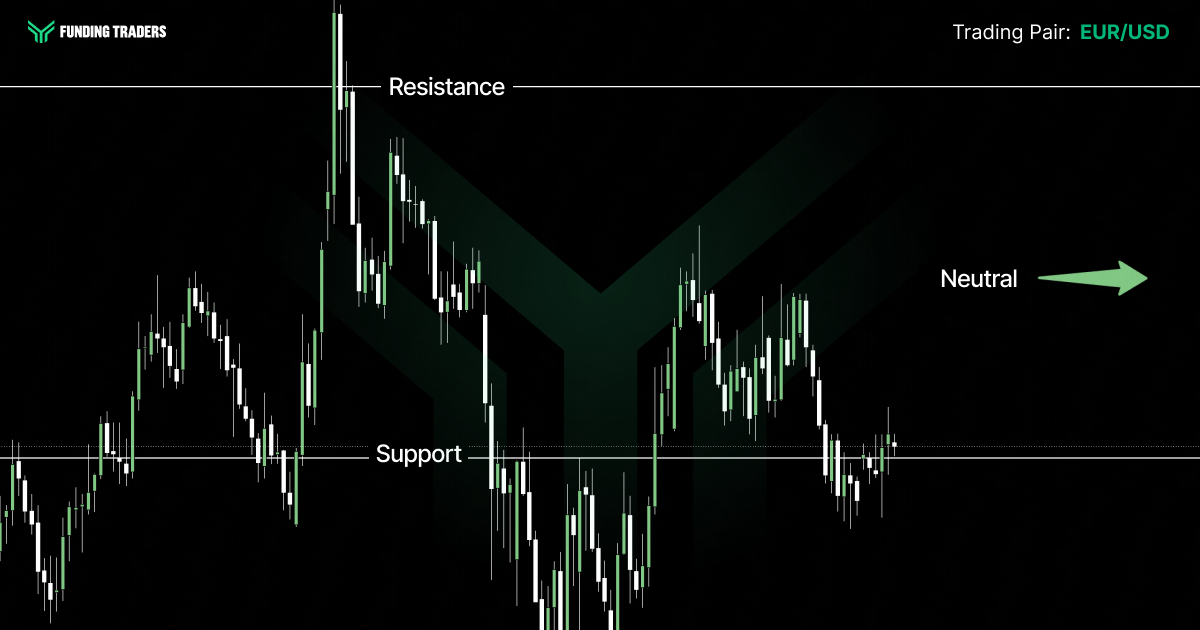
The euro slipped to a six-week low against the dollar into month-end, but the setup is more interesting than the price suggests. The single biggest driver is timing: the European Central Bank looks set to raise rates on June 11, with markets pricing roughly nine-in-ten odds, because eurozone core inflation is still running above target, partly thanks to the same energy shock that’s rattled everyone else.
That makes Tuesday’s flash inflation print the week’s first euro catalyst. A hot number hardens the hike case; a soft one muddies it. For now the pair is range-bound with a modest upward lean, held back by a dollar that refuses to roll over. The technical map is clean: hold above 1.1640 and the structure stays constructive, with 1.1765 then the 1.1800–1.1974 zone as the upside tests; lose 1.1640 and 1.1550 and the March low near 1.1476 come into focus. Longer term, several desks, Goldman, Deutsche Bank and MUFG, still see a path toward the low-to-mid 1.20s as US rates compress.
GBP/JPY
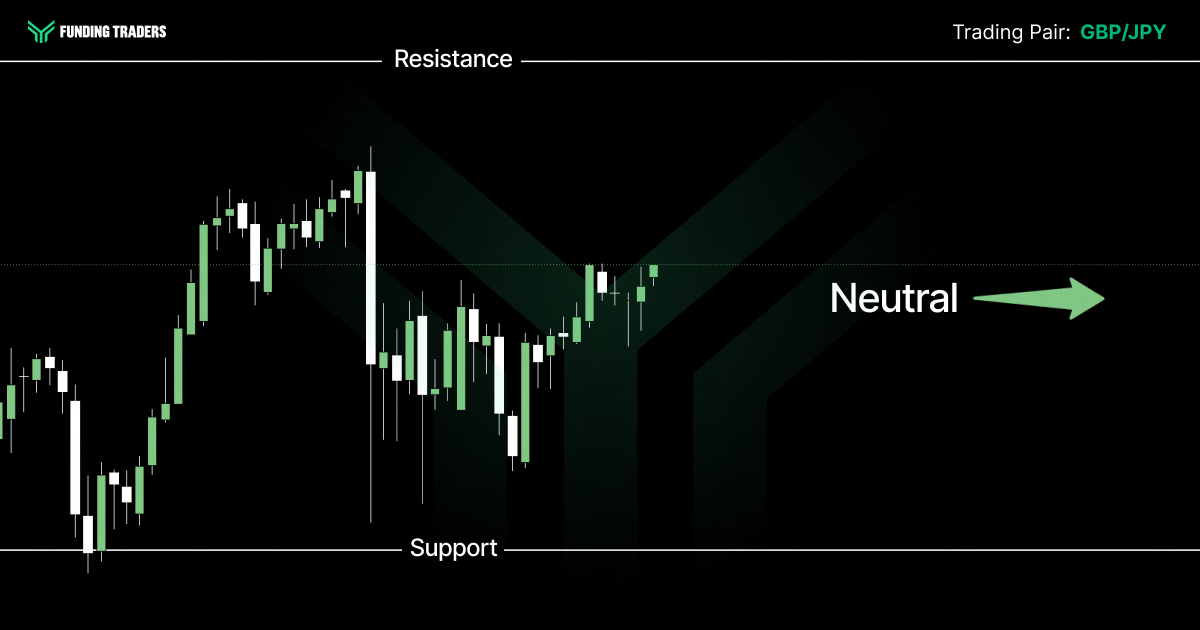
This cross has been a one-way story for one simple reason: yen weakness. Japan’s economy gave a soft signal as first-quarter business spending flatlined, the Bank of Japan is tightening only slowly, and higher oil widens Japan’s import bill, all of which keeps the yen on the back foot. Sterling, meanwhile, has been resilient, and Governor Bailey speaks several times this week, so expect pound volatility around any policy hints.
The catch is the ceiling. As the yen weakens, the risk of official intervention climbs, and that tends to spark sharp, fast reversals rather than slow drift. Wednesday’s BoJ commentary is the one to watch. With the pair firm near 214.6, treat 216–218 as the zone where reward-versus-risk deteriorates and 212–210 as the first support if a yen-strength headline lands.
USD/JPY
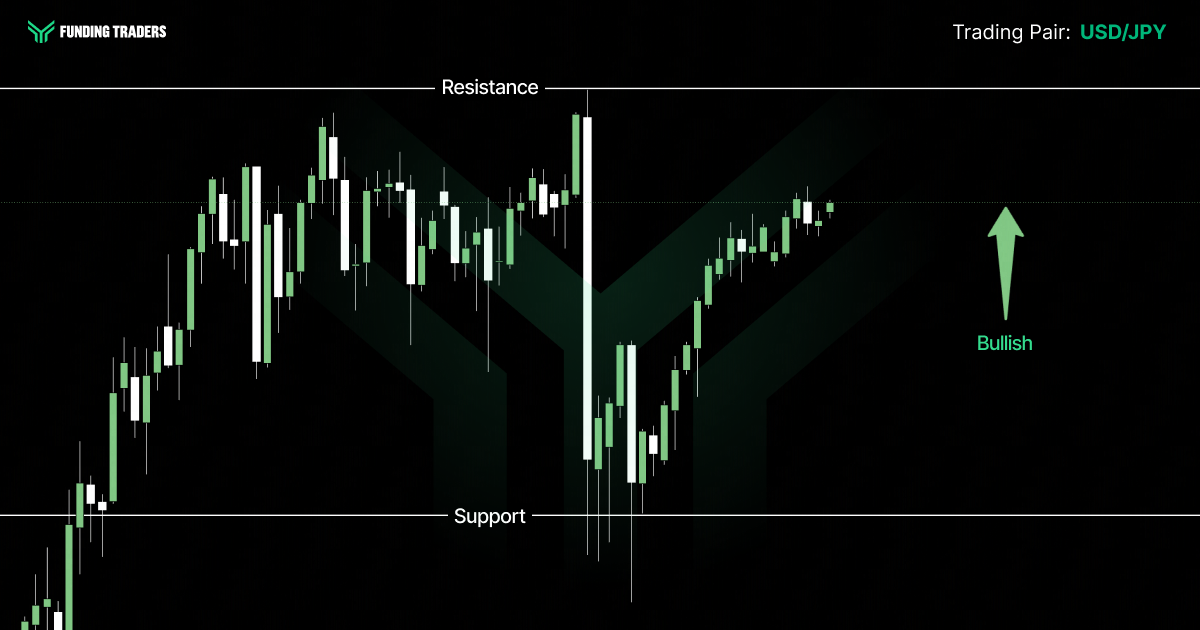
USD/JPY is the cleanest expression of the policy gap on the board: the Fed is leaning hawkish while the BoJ inches toward normalization, and the resulting yield advantage keeps the dollar bid. The pair pressed toward a two-week high near 159 into the new week, not far from the 52-week peak around 160.74.
That 160 line is the whole game. Japanese authorities have already spent an enormous sum defending the yen, roughly ¥11.7 trillion in the late-April-to-late-May window, and another lurch toward 160 would put intervention squarely back in play. So the bias is higher, but capped, and the risks are asymmetric near the top of the range. For context, ING carries a 148 year-end view while Exchange Rates UK sits closer to 154, both softer than spot, reflecting the expectation that the rate gap eventually narrows. This week, the BoJ speech Wednesday and US payrolls Friday are the two events that move it.
USD/CHF and AUD/USD
These two pairs tell opposite halves of the same risk story. The Swiss franc is the market’s other classic safe-haven, with the Swiss National Bank still at a zero policy rate and ready to lean against excessive franc strength. The twist in 2026 is that the franc now competes with an unusually firm dollar for haven flows, which has kept USD/CHF rangebound near 0.78 rather than collapsing as many analysts expected. Switzerland’s GDP on Monday and CPI on Thursday are the local color; the dollar’s path is the main event. Watch 0.7760 below and the 0.7930–0.8000 band above.
The Australian dollar is the opposite: a risk-on, China-sensitive currency that lives by commodity demand and global sentiment. This week it has a packed local calendar, Australian GDP on Wednesday, sandwiched between China’s manufacturing and services PMIs, which act as a real-time read on the region’s economy. Holding near 0.7175, the Aussie needs steady global markets and firm China data to push toward 0.7250; a risk-off wobble or weak China print exposes 0.7120.
WTI Crude Oil
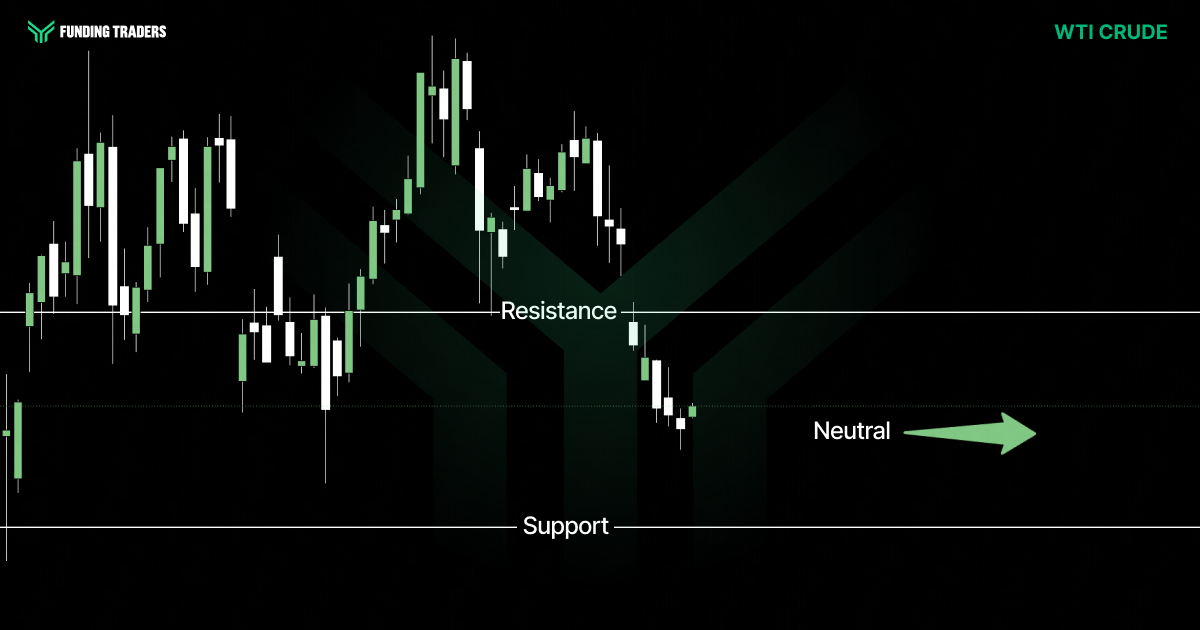
Oil was the headline trade of the spring, and in May it went the other way, hard. WTI slid to a six-week low around the mid-$80s and posted its worst month since the pandemic, roughly a 16–17% drop, as the US and Iran moved toward extending their ceasefire and easing Strait of Hormuz restrictions. Brent followed, hovering near $91.
But this isn’t a clean all-clear. The waterway that carries about a fifth of the world’s oil is still largely shut, the ceasefire deal still needed Trump’s sign-off, and the supply mechanics are tight: UBS notes Gulf crude loadings remain very low, Goldman Sachs warns refined-product buffers are draining fast, and Saudi Aramco’s chief cautioned the market may not normalize until 2027 if Hormuz stays blocked past mid-June. Even the optimists, like the International Capital Markets Association’s Bob Parker, see crude in a roughly $90–100 band near-term, with any reopening “partial” at first. The bias is two-way with a softer tilt, but the gap risk is firmly to the upside, so watch the headlines as closely as the chart. $80 is the line below; a move back above the low-$90s says the war premium is rebuilding.
Key Economic Events: June 1 – June 5 (GMT+3)
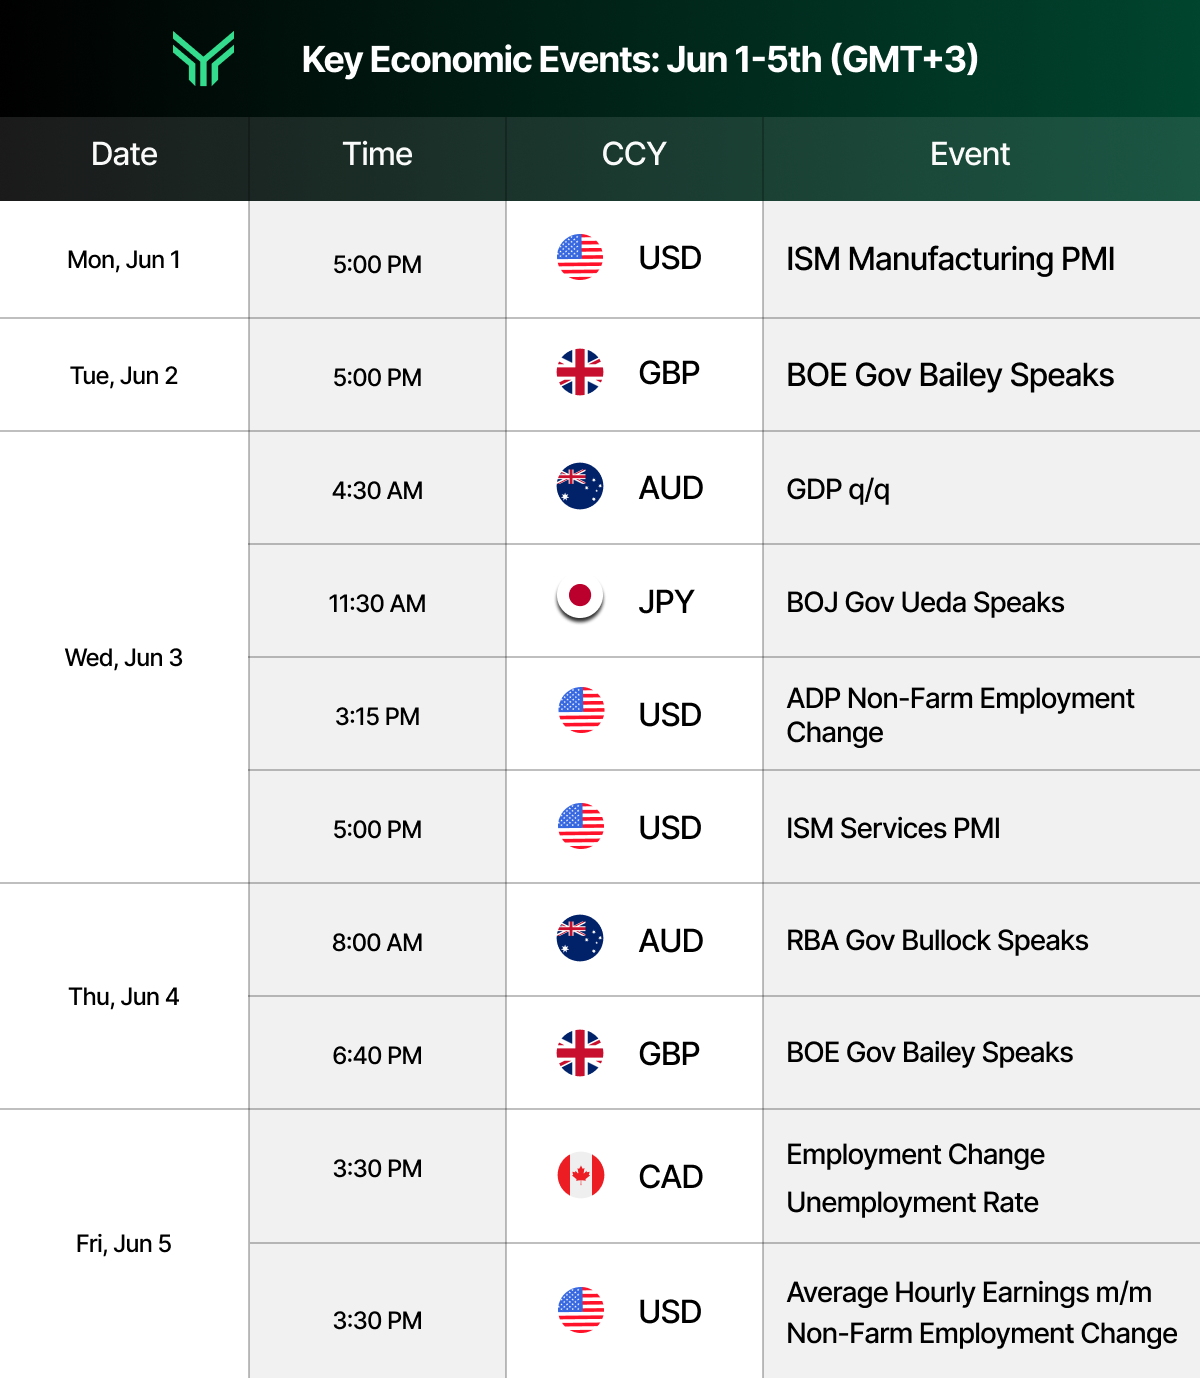
This condensed calendar is adapted from the Forex Factory economic calendar at forexfactory.com, a leading resource professional traders use to track market‑moving macro news and central bank events in real time.
Asset Watchlist: Market Intelligence Snapshot
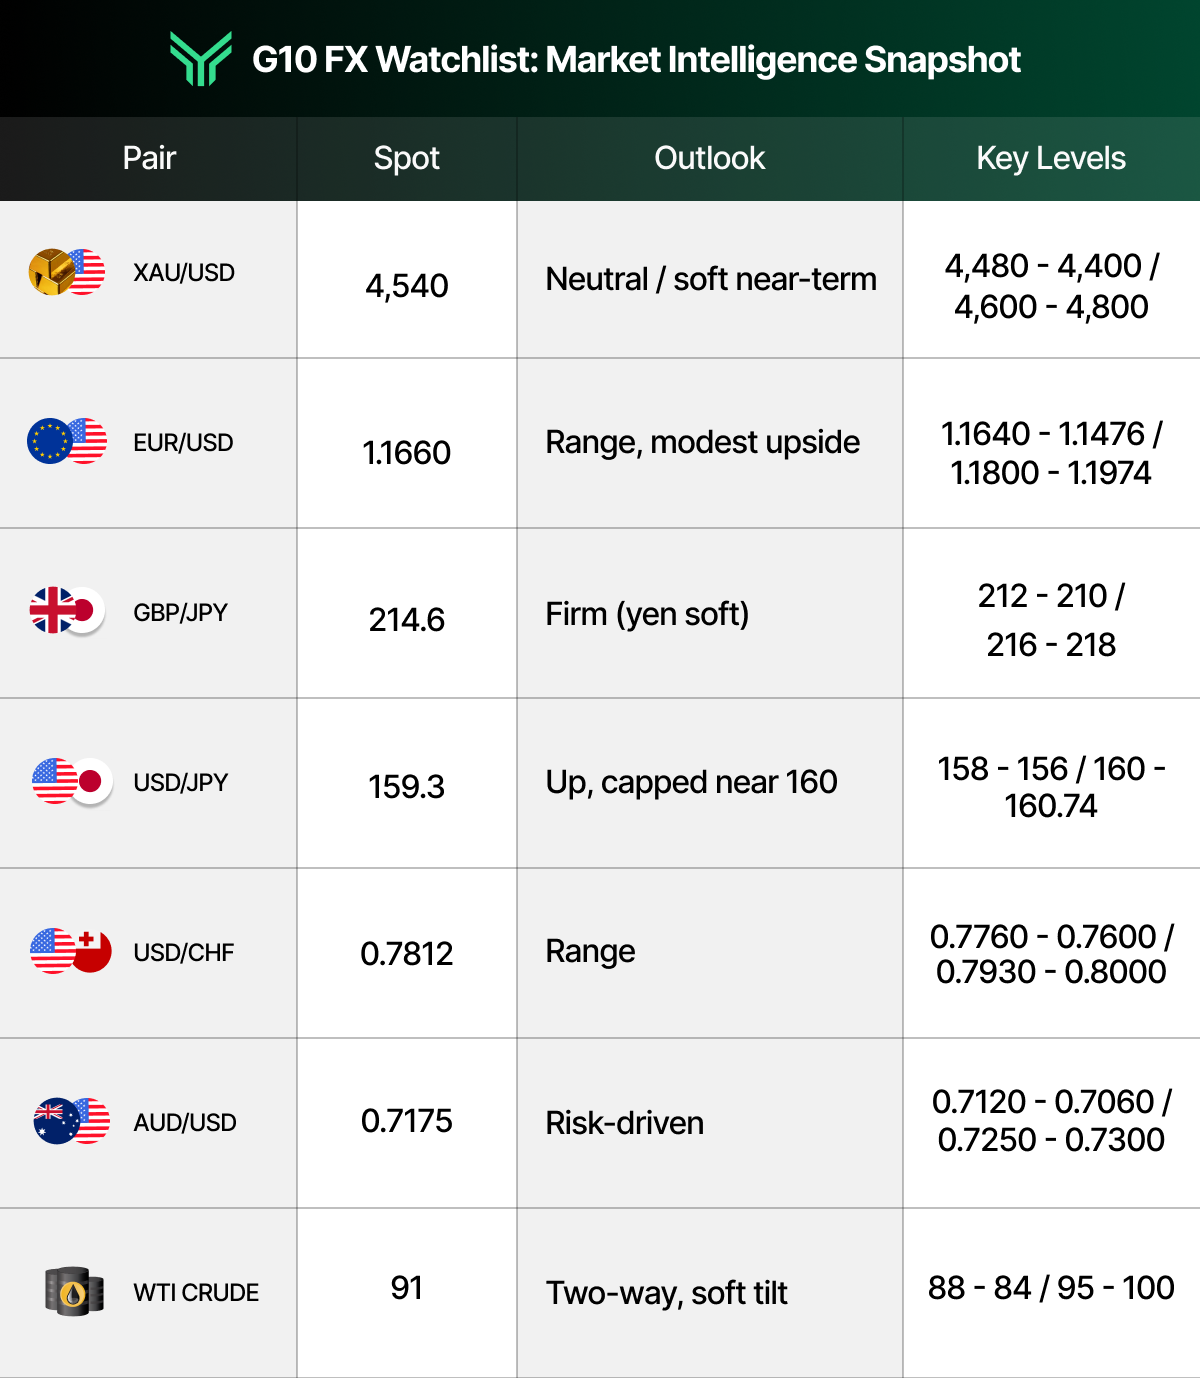
This table delivers market insights at a glance, helping traders quickly analyze key levels and understand current trends.
Actionable Insights for the Week to Drive Growth
In this market, preparation is the trader’s real edge, not prediction. The traders who do well this week won’t be the ones who guessed the payrolls number; they’ll be the ones who already knew exactly how they’d react to either outcome. Here’s a simple framework.
The Base Case. With peace talk dominating and the dollar firm, the path of least resistance is a softer commodity complex and a capped-but-firm greenback. That argues for selling rallies in crude toward the low-$90s with a stop above and an eye on $80, buying euro dips above 1.1640 into the ECB rather than chasing 1.18, and respecting USD/JPY’s grind higher while refusing to add fresh longs into the 160 intervention zone. Gold sits best as a range trade, fade strength near $4,600, look for buyers near $4,480, until the new Fed chair’s tone is clear. Equities stay constructive above 7,450, but size positions for a choppy, two-sided June.
The Triggers That Flip The Thesis. This is where the week gets paid. A collapse in the ceasefire or fresh Hormuz escalation flips everything: oil gaps higher, gold and the franc catch a haven bid, and risk assets wobble, so keep alerts on the headlines, not just the charts. A hot payrolls print Friday supercharges the hawkish dollar, presses gold lower and lifts hike odds; a soft one does the reverse and can ignite a relief rally in equities and the euro. A dovish surprise from Powell on Monday would compress real yields and lift bullion, and a hot eurozone inflation print Tuesday cements the ECB hike and gives EUR/USD a reason to break range. Lean on a live economic calendar, keep this watchlist open, and let your risk plan, not your emotions, do the work. Sound risk management and a clear maximum drawdown are what turn a volatile week into a profitable one.
A plan is only worth something if you’ve got the capital to run it. Take this exact Phase One / Phase Two framework into a funded account, keep an industry-leading share of what you make, and scale up as you prove consistency. Right now, code FT50 cuts your evaluation fee in half across every size, $5K to $200K, the lowest-friction way to put real size behind a high-conviction week.
Stay Ahead of the Market
Step back and the week’s framework is simple, even if the moving parts aren’t. A new, more hawkish Fed chair has reset the rate conversation, a fragile ceasefire is slowly bleeding the war premium out of oil, and a single jobs report on Friday could decide whether the calm holds or cracks. That’s the macro spine of this week’s Market Insights, a market caught between de-escalation and a dollar that won’t quit.
The traders who stay ahead here treat market intelligence as a routine, not an afterthought: clear levels, a live calendar, and a plan for both the base case and the surprise. That’s exactly the kind of high-conviction, macro-driven setup FundingTraders is built for, a platform that lets serious traders turn a well-researched view into a funded, scalable opportunity without fighting the rulebook.
Don’t just read the week, trade it. Get funded, keep more of your profits, and get paid on a weekly cycle while you scale toward a larger account. For this month only, code FT50 takes 50% off every challenge from $5K to $200K, your sharpest edge starts with your cheapest entry.
Disclaimer: Trading involves significant risk and is not suitable for every investor. Past performance is not indicative of future results. The information provided in this article is for educational and informational purposes only and should not be considered financial, investment, or trading advice. All account rules, payout structures, profit splits, and promotional offers described in this article are subject to change at the discretion of FundingTraders. Promo codes may expire or be modified without prior notice. Always trade responsibly and only risk what you can afford to lose.