Traders who struggle with holding losing trades rarely study the part of their history that exposes the habit: the timestamps. Try a 20-minute exercise. Export your last 50 closed trades and tag each row as a win or a loss. Then hide every money column and compare how long each group stayed open.
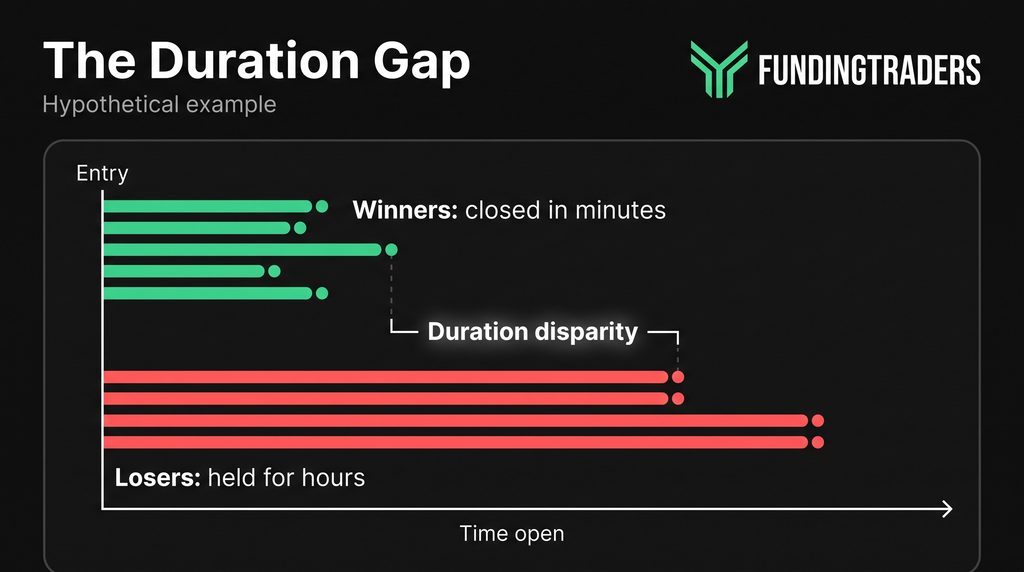
In most logs, the losing trades win this particular contest: they stay open several times longer than the winning ones, often hours against minutes.
Traders call that lopsided split duration disparity. P&L mixes skill with luck; this split isolates one behavior, how you leave trades, and shows whether your exits still match the plan you wrote before entry.
Duration Disparity, Defined in Minutes
Average the holding time of your closed winners, do the same for your losers, and the difference is your duration disparity. If R is your risk per trade, a 2R target sits twice as far from entry as a 1R stop, so winners should usually need at least as much time as losers, often more. A trend-following strategy collects its profit from the long middle of a move, while a bad entry tends to show its hand within minutes.
Most trade histories turn that upside down, whatever the instrument. Picture two open trades (illustrative numbers): a GBP/USD long up 12 pips after 20 minutes, your cursor already on the close button, and a USD/JPY short down 26 pips after two and a half hours, untouched since lunch. Odds are the GBP/USD trade is the one that gets closed next.
Prospect theory offers a widely cited explanation: people tend to judge a trade against a reference point, often their entry. Below it, they tend to gamble to avoid locking in a loss (risk seeking); above it, they settle for a smaller, surer gain (risk averse). Behavioral finance calls the resulting habit, banking profits fast and leaving losses open, the disposition effect.
No entry is immune to exits like these: clipped winners make every good idea pay less, while every bad idea still costs its full stop, or more if the stop moves.
Five Holding-Time Shapes and the Warnings They Carry
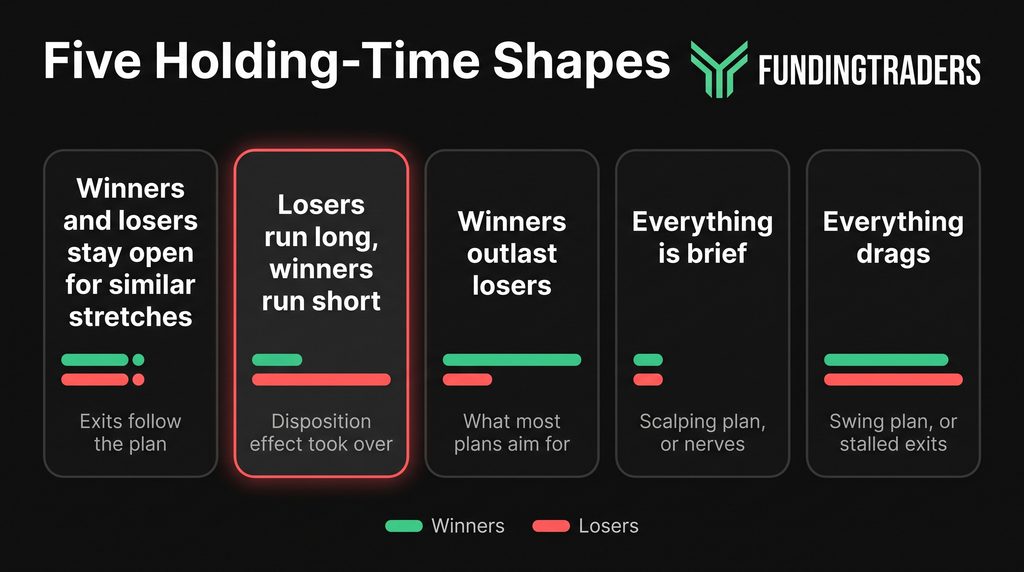
Your balance is a scoreboard: it totals the outcome without naming a single decision behind it. Holding time works more like an oil pressure light, which tends to flicker well before the engine seizes, and it usually settles into one of five shapes:
- Winners and losers stay open for similar stretches. Exits are probably landing where the plan put them, so a weak month here more likely reflects normal variance than a broken routine.
- Losers run long, winners run short. On a plan that risks 1R to make 2R, this shape often means the average win has slipped below the average loss, because profits get taken at the first wobble while losing trades are left open to wait for a rescue. That is the disposition effect, now running your exits.
- Winners outlast losers. Failed trades leave early and good ones get room to travel, the pattern most plans are designed around. If your log shows it, protect whatever routine got you there.
- Everything is brief. On a scalping plan, that is the design (see how a prop firm supports scalpers). On a plan built for multi-hour trades, it often means open risk feels so uncomfortable that every position gets closed within minutes.
- Everything drags. A swing trader expects this (more in our guide to choosing a prop firm for swing traders). On an intraday plan, it tends to mean the exit decision has stalled, leaving the session close or a stop to decide.
If your log shows the fourth shape, mind FundingTraders’ floor on speed. The General Trading Guidelines flag an account for review when its volume-weighted average holding time (VWHT) is under 2 minutes, with termination listed as the action, and do not allow high-frequency strategies built on trades of 15 seconds or less. On funded accounts, the Risk Management Group adds a pattern: “More than 50% of trades held under 2 minutes, or a majority of period profits coming from those trades.”
The evaluation phase is not exempt from scrutiny either: when you reach the target, the Risk team reviews your history, and behavioral violations may mean the funded account starts at Warned, Tier 1 or Tier 2.
Of the five shapes, the second does the most damage because it can hide under a healthy-looking balance. For months, a steady supply of small wins can offset the full-sized losses well enough that the balance raises no alarm. The cushion usually gives way in a single choppy week, when three or four stubborn losers cluster together. The statement files that under a rough week; your trade log would file it as the sum of dozens of small exit decisions.
Catch that gap early with a duration log from the first trade on a fresh account. Get one at half price plus a free matching account, delivered instantly with no waiting until you’re funded, at express checkout (Spooky Week code: SCARY). All FundingTraders evaluations and funded accounts take place in a simulated environment.
What Keeps You Holding Losing Trades
Pressing close on a loser does several jobs at once: it marks your analysis as wrong, turns floating P&L into a settled result, and ends the chance that price comes back to rescue it. Research in behavioral finance adds weight: losing an amount tends to sting roughly twice as sharply as gaining the same amount pleases. Next to that sting, postponing the click feels cheap, and a chart crowded with levels and indicators can keep arguing for one more candle.
Freeze the screen on a hypothetical morning trade in a US stock index. Your stop, a mental note rather than an order, was 30 points below entry; price now sits 45 below. Listen to the commentary:
- “There is a support zone just below. Buyers usually defend it.”
- “RSI is buried below 30. Sellers have to be exhausted by now.”
- “A data release is due in 40 minutes. That will sort it out.”
- “My stop was too close for this volatility. Widen it and let the trade work.”
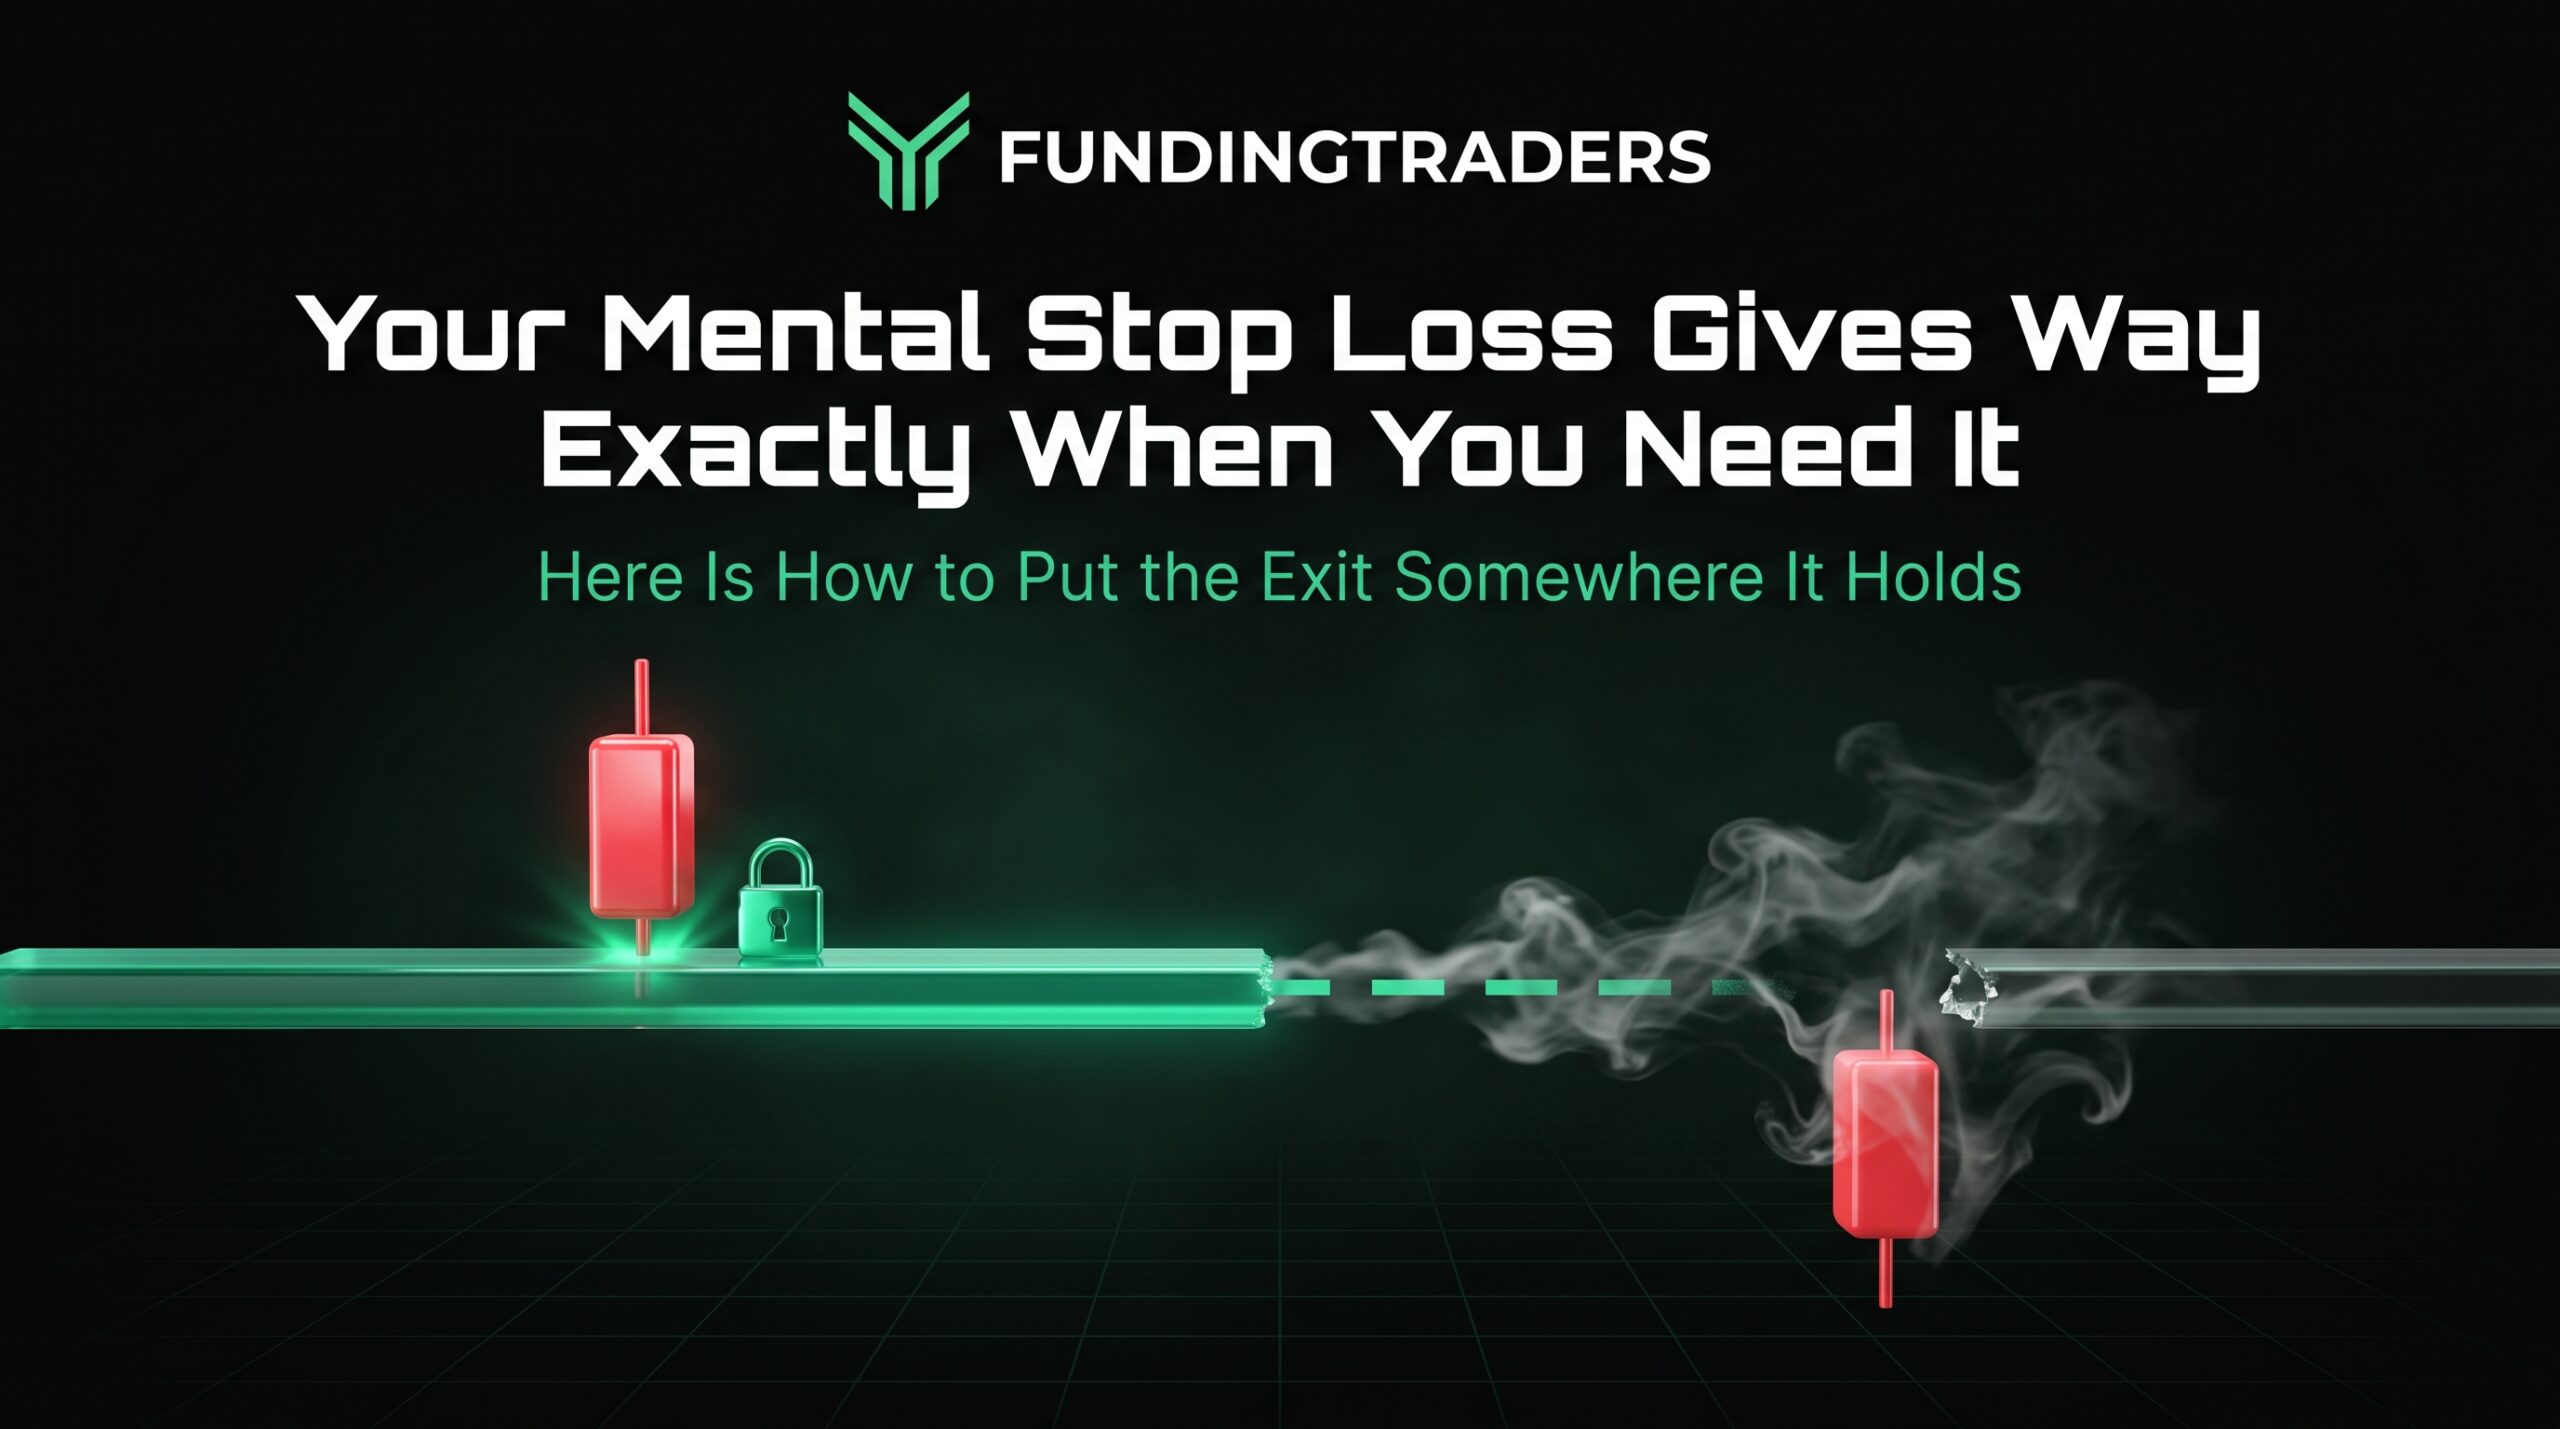
None of the four was in your plan before entry, and all vote for the same outcome: staying in. Analysis that only votes one way is a request for more time. A mental stop loss gives way in exactly this moment, which is why the exit belongs on the platform.
Each minute of delay raises the exit’s price: at 30 points down, closing was a planned loss; at 45, it also admits a broken plan; by 70, it confesses to a whole morning of looking away. Holding losing trades piles embarrassment onto the exit while the loss can keep widening.
After most of a session spent in the red, the urge to get even before the day ends can be strong, and the order that finally closes the loser is often followed almost at once by a fresh one. The Risk Management Group counts that sequence among its four core rules for funded accounts, under the name Revenge: “After a losing trade of 0.5% of account size, a new position opens within 5 minutes on any symbol.” An entry whose only purpose is to repair the day is usually the first step into the overtrading trap.
Banking Winners Too Soon
Nobody audits a green row in the journal, which is how early exits stay off most traders’ list of problems.
Now take a winner, with illustrative levels: you are long EUR/USD from 1.0850, stop 15 pips below, target 30 above. Twenty minutes in, the position shows +14 and your eyes keep drifting to the entry line instead of the target. Each two-pip pullback looks like the start of a round trip to zero.
Clicking close at +14 brings instant calm. In this illustration, EUR/USD reaches 1.0880, your planned target, within the hour and keeps climbing. Measured against the plan, you risked 15 pips to collect 14: a little under 1R on a setup sized for 2R.
Psychologists call what happens next negative reinforcement: behavior that switches off an unpleasant feeling tends to be repeated. Today’s exit at +14 becomes +13 next week, then +12, and winners the plan sized at 2R settle near 0.8R.
A Spreadsheet Log for Duration Disparity
Open a blank sheet and give each closed trade one row with four columns:
- Entry date and time
- Exit date and time
- Result, in pips or in R
- Holding time, in minutes
With a meaningful sample (50 trades is a sensible start), work out the mean hold of your winners, the mean hold of your losers, and your duration disparity ratio: mean loser hold divided by mean winner hold.
Near 1.0, both groups stay open about equally long. Above 1.0, losers get more of your time; at 2.0 they average double the winners’ screen time, too wide a gap to blame on noise. At 3.0 or above, check whether realized reward-to-risk has drifted from the design, as it has in the example below.
Recompute it every month. The ratio and the balance can disagree for a while, and when they do, the ratio is usually the one describing your exits honestly: luck can carry a month’s P&L, but it rarely carries a ratio for long. The log turns the habit of holding losing trades into a number you can watch.
FundingTraders’ VWHT check weights holding time by size (each trade’s hold multiplied by its volume, summed, divided by total volume). If your size varies, weight your averages too, so a string of small, quick trades cannot dilute one oversized loser held for hours. The Clarity Desk on funded accounts does not compare winner and loser holding times, so this log is yours to keep.
A Worked Example (Hypothetical)
Suppose your last 50 closed trades split into 25 winners and 25 losers, a 50% win rate. The plan calls for 1:2 (risk 1R to make 2R), and you honor every stop, so losers still average 1R.
| Trade group | Count | Average hold | Average result |
|---|---|---|---|
| Winners | 25 | 35 minutes | +0.8R |
| Losers | 25 | 1 hour 45 minutes (105 minutes) | -1R |
The duration disparity ratio is 105 divided by 35, or 3.0. Now set the plan beside the execution:
- As designed: 0.5 x 2R minus 0.5 x 1R = +0.5R per trade, or +25R over 50 trades.
- As executed: 0.5 x 0.8R minus 0.5 x 1R = minus 0.1R per trade, or minus 5R over 50 trades.
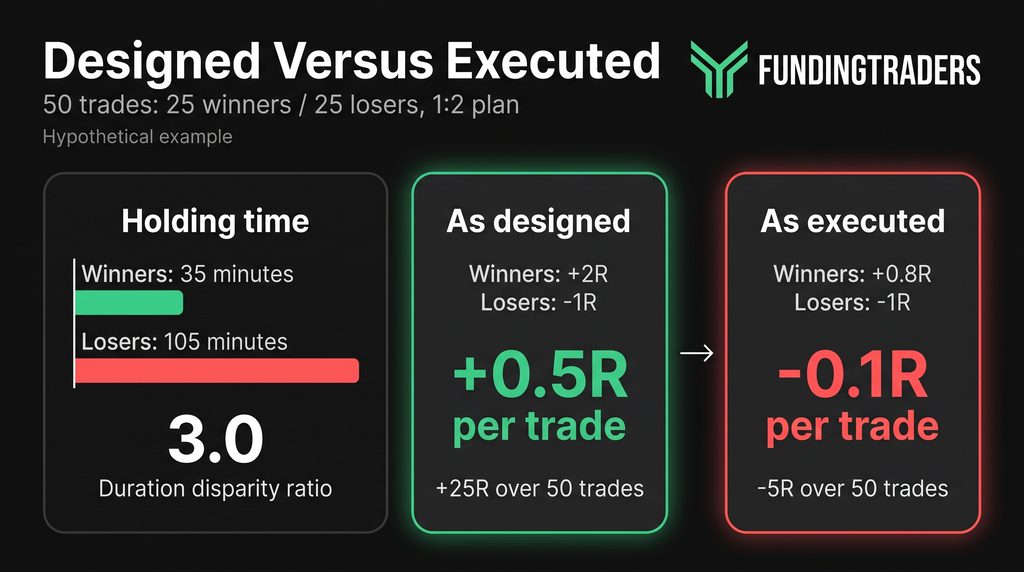
Entries, stops and win rate are unchanged. Assuming each winner you cut would have reached 2R as planned, the early exits alone move the result by 30R (25 winners x 1.2R), from a positive edge to a negative one. With every stop honored, all of the lost edge sits on the winning side, and the timestamps (35 minutes against 105) point straight at it.
Give your next 50 winners room to reach their targets on a FundingTraders account at half price, with a free matching account (same account type, size and add-ons) delivered instantly when you claim both accounts with code SCARY.
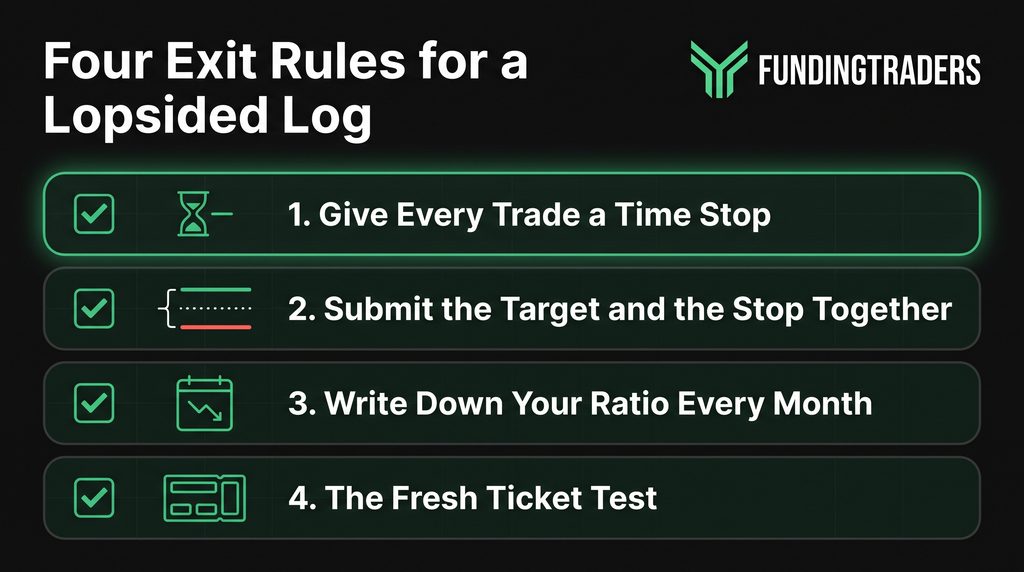
Four Exit Rules for a Lopsided Log
None of these rules touch your entries; all four shrink duration disparity from the exit side.
1. Give Every Trade a Time Stop
A price stop says where the idea is wrong; a time stop says how long it gets to prove itself. Pair the two on every position, and when the deadline arrives with neither level touched, close at market.
Think of hotel checkout: the room is yours until a fixed hour, however comfortable you are. Set the time by style: roughly a quarter of an hour for scalpers, the session close for day traders, a couple of trading days for swing traders. Note it in your journal at entry, and if a swing deadline would span a weekend, check your account type’s help article first.
Plenty of losers never reach their stop; they hover just underwater for hours, like a guest who will not leave the room. The deadline moves them along and frees margin and attention for the next setup.
2. Submit the Target and the Stop Together
Promising yourself more patience rarely survives the next green trade, so take the decision out of the moment. Type the take-profit and stop loss before you submit the entry, send all three together, and treat the open position as read-only until a level fills or the time stop arrives. More in our set and forget trading guide.
Expect some trades to peak a whisker below the target and fall back. Fixed exits turn those into stop-outs or time-stop scratches, and the win rate your plan was built on already counts them. Trimming every winner to dodge them costs far more, because across dozens of trades a 1:2 plan depends on an average win near 2R, not 0.8R. Once both orders are working, the chart has nothing left for you to decide, so get up from the desk until a level fills or your time stop is due.
Avoid one shortcut: making early exits official with targets well inside your stops, which at 0.8R against 1R writes the losing example above into the order ticket. On funded accounts, the Risk Management Group also flags systematically negative planned risk/reward (more than 60% of comparable setups with planned reward under 0.9x risk, or more than 60% of period profits from them). A first detection is a courtesy warning; a second moves the account to Warned if it is still Standard, or applies a strike if protective controls already apply.
That rule checks the reward-to-risk you plan, not what you bank when you close a winner early, so the realized gap is yours to watch.
3. Write Down Your Ratio Every Month
Block one day a month to export the previous month’s trades, calculate both mean holds and the ratio, and log it. If the month held fewer than 50 trades, note the count beside the ratio so a thin month does not skew the trend.
Put six monthly readings side by side and the direction is hard to argue with. When the line will not come down, look at which average is doing the damage: winners getting shorter send you back to rule 2, losers getting longer to rules 1 and 4. A ratio written down every month is a narrow version of the “track everything” habit in our piece on trading psychology for disciplined traders.
4. The Fresh Ticket Test
Once a position has outlived its usual life span, open a blank order on the same symbol and ask whether you would send it at the price on screen, with the same stop and target. If your finger stays off the button, close the original.
The pull you feel to keep it anyway has a name: anchoring. Your fill price becomes the yardstick for every later decision (“I’ll get out at breakeven”), even though the next tick will be set by other traders’ orders, and none of them know where you got in. A blank ticket takes that yardstick away, which is why the test feels uncomfortable and why it works.
One Rule, Six Months: A Hypothetical Walk-Through
This is a hypothetical composite, not a real trader. Suppose you have years of screen time. Your entries are solid and your stops hold, yet results swing month to month, the drawdowns run deep, and your duration log shows a ratio of about 3.0.
Setups, indicators and size stay as they are. The only addition is a deadline noted at entry, leaving three possible exits: target, stop or clock. Until one arrives, the trade is left alone: no early profit-taking, no widened stop. If the deadline comes first, you close at market and accept the result.
Charted month by month, the ratio falls fastest at the start: from about 3.0 to roughly 1.0 over the first quarter, then under 1.0 by the half-year mark. Under 1.0 is the third shape from earlier, where winning trades get the longer leash: each runs until the target or the clock ends it, and in this illustration the average win has climbed back toward the planned 2R.
In this walk-through, the decisive step comes before any time stop is set: it is the month your duration disparity first lands in the spreadsheet as a number. An unmeasured gap is easy to blame on bad luck; a 3.0 in your own log is much harder to wave away, and every monthly reading after it shows whether the gap is closing.
What would your ratio look like after a few months of time stops? Find out on a FundingTraders account at 50% off plus a free matching account, both yours instantly with no waiting until you’re funded, at FundingTraders checkout using code SCARY.
Frequently Asked Questions
What is duration disparity in trading?
Duration disparity measures the difference in average holding time between your losing and winning trades. Divide the mean loser hold by the mean winner hold to get the ratio; a reading well above 1.0 suggests your exits are drifting from the plan.
Why do traders keep holding losing trades?
Mostly because closing them hurts. Closing locks in an unrealized loss and concedes the idea failed, and behavioral finance research suggests a loss stings roughly twice as much as an equal gain pleases. So traders delay, and the loss often widens.
What is a good duration ratio for losing versus winning trades?
A duration disparity ratio near 1.0 (average loser hold divided by average winner hold) is consistent with exits that follow the plan. Below 1.0, winners outlast losers, the ideal for most strategies. A reading of 2.0 or more deserves attention, and 3.0 or above often goes with eroding reward-to-risk.
Does FundingTraders limit how long or how short I can hold a trade?
On the short side, yes. The General Trading Guidelines flag a volume-weighted average holding time (VWHT) under 2 minutes, with termination listed as the action, and bar high-frequency strategies built on trades of 15 seconds or less. On funded accounts, the Risk Management Group also flags more than 50% of trades held under 2 minutes, or a majority of period profits from them (minimum 10 closed trades), and evaluation history is reviewed at the target. Weekend and overnight holding depends on the account type, so check that account’s help article.
Read Your Timestamps Before Your Totals
Results carry luck both ways, so execution can slip for months without the balance saying a word. The slip tends to surface in your holding times first, as winners get closed within minutes and holding losing trades for hours becomes routine. Your duration disparity ratio can catch it well before the P&L does, because it scores what you did, not how the market treated you.
The upkeep is small: one log row per trade, one ratio a month, and exit rules (time stops, fixed targets, the fresh ticket test) that hold when your patience runs thin. Add that column of minutes, keep it honest, and let it explain the rough stretches that a trade-by-trade review keeps missing.
Disclaimer: Trading involves significant risk and is not suitable for every investor. Past performance is not indicative of future results. The information provided in this article is for educational and informational purposes only and should not be considered financial, investment, or trading advice. All account rules, payout structures, profit splits, and promotional offers described in this article are subject to change at the discretion of FundingTraders. Promo codes may expire or be modified without prior notice. Always trade responsibly and only risk what you can afford to lose.