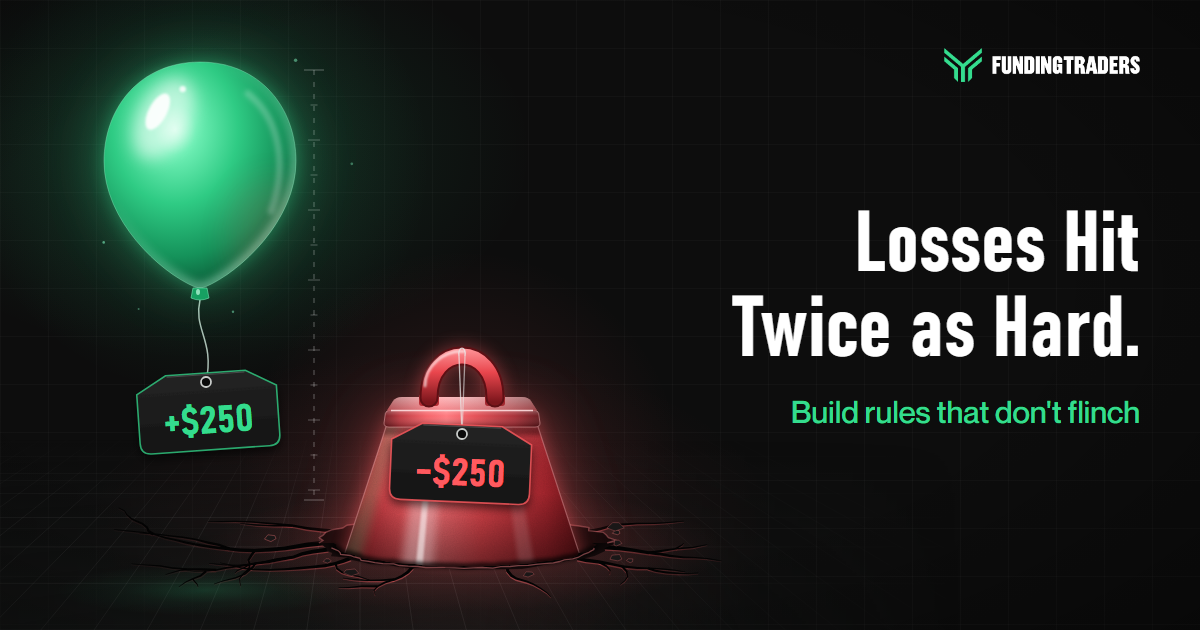
Watch one number in the session below, $200, because loss aversion in trading will go to work on it twice.
You’re trading a hypothetical $50,000 evaluation account and risking 0.5% per idea, which is $250. Call that 1R; R is shorthand for the dollars one trade has on the line. Each trade goes on with a stop at minus $250 (1R) and a target at +$500 (2R).
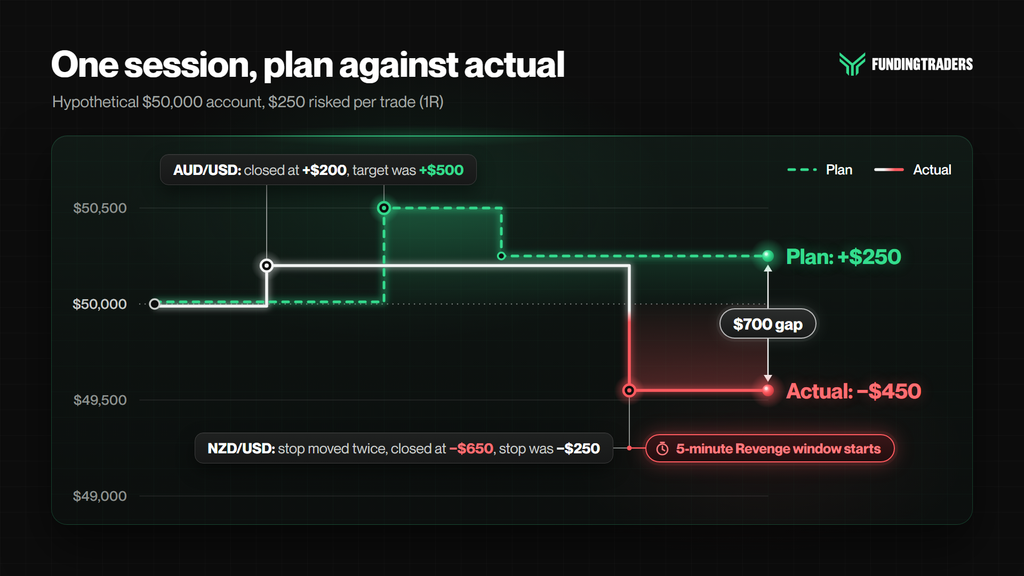
Late morning, your AUD/USD long starts to work. The open profit climbs to +$200, or 0.8R. That $200 already feels like yours, and every small dip makes it feel less safe. So you close, worried it will slip away. Hours later, price drifts up to your old target: +$500 you’d have banked by doing nothing.
After lunch, your NZD/USD short goes the other way. The open loss reaches minus $200, also 0.8R, with the stop only $50 further out. This time you shield the trade instead, pushing its stop further off so the platform can’t close it for you.
The screen showed you the same $200 twice, once green and once red, and you did the opposite thing each time: closed the green one, refused to close the red one. Both clicks, inside one session, came from loss aversion in trading.
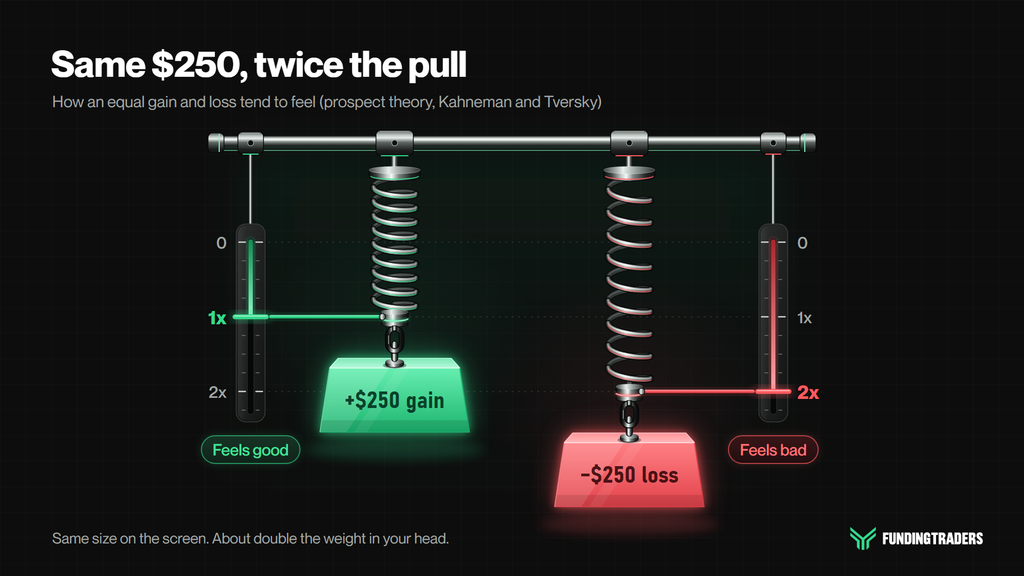
The pull behind each click is older than any chart: a loss tends to weigh about double an equal gain. Left in charge, it builds a familiar record of small wins taken early and big losses carried long. What follows tracks each place loss aversion slipped into the session, then sets out five routines that decide before the feeling arrives.
The Science Behind Loss Aversion in Trading
The $250-to-$500 math in the title has a source: prospect theory, the model Daniel Kahneman and his research partner Amos Tversky built to describe choices under risk.
It starts from a plain observation: people react to changes in what they have more than to the total. Your $50,000 balance barely moved either time, yet each $200 swing landed like news. In Kahneman and Tversky’s work, losses carried roughly double the weight of equal gains, with later estimates near 2.25.
In this session’s money, the platform books a stop-out as minus $250; the part of you doing the feeling books it closer to minus $500. That same weighting is why the $200 felt like something to protect in the morning and something to bargain with in the afternoon.
Why would a mind work this way? One common explanation looks back to places where a household’s food store had to last the winter: losing it could mean not surviving the season, while finding a little extra meant a slightly better week. Brains that weighted the loss more heavily may have seen more springs. The hungry winters are mostly gone; the weighting seems to have stayed. Spotting it, then building your trading so loss aversion decides nothing mid-trade, is a big part of what sets profitable traders apart from gamblers.
What FundingTraders’ rulebook can measure is narrower: the orders loss aversion produces, such as a trade’s planned risk, a stop missing at exit, how soon the next position opens and how close a day runs to its limit.
Four Ways Loss Aversion Leaks Into a Trade
Follow the session in order and loss aversion shows up at four points: the green exit, the red stop, the minutes after the close and the rest of the day.
1. Cutting Winners Short
The click comes at 0.8R, forty minutes in, and only afterward do you notice what led up to it: the chair pulled closer, the red one-minute candles looking taller than they were, your eyes parked on the +$200 figure instead of the target line. Your shoulders drop an inch.
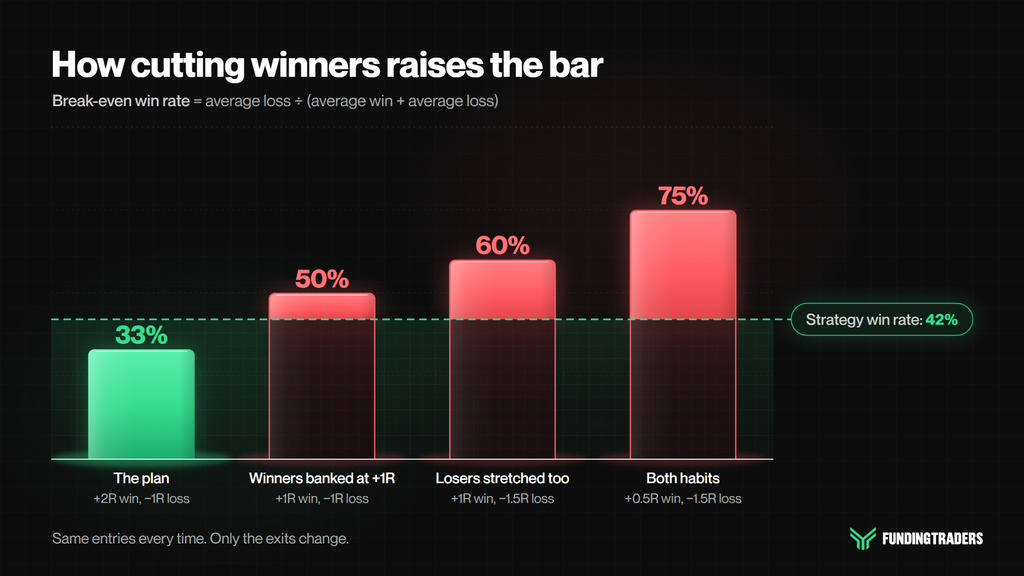
That wave of relief is the reward loss aversion hands out for closing. The bill comes later, in the break-even win rate: the share of trades a strategy must win just to stay level. It’s average loss divided by (average win plus average loss), both in R. Watch it climb as exits slip:
| Exit habit | Average win | Average loss | Break-even win rate |
|---|---|---|---|
| The plan | +2R | -1R | 33% |
| Winners banked at +1R | +1R | -1R | 50% |
| …and losers stretched to -1.5R | +1R | -1.5R | 60% |
| Winners banked at +0.5R, losers at -1.5R | +0.5R | -1.5R | 75% |
Pair those exits with a hypothetical strategy that wins 42% of its trades. Over 100 trades at $250 per R, the plan gains $6,500 (+0.26R a trade); both habits at full strength lose $16,500 (minus 0.66R a trade). The entries stayed the same; only the exits moved, and the bar climbed from one win in three to three in four.
Loss aversion can reach the order ticket too: a trader who keeps banking near +$125 may start typing +$125 targets on $250 stops, planning 0.5 times the risk on every setup. On funded accounts, the hygiene pattern for negative R:R looks for planned reward under 0.9 times risk on over 60% of comparable setups (minimum 10 closed trades). A first detection gets only a courtesy warning; a repeat pushes the account up the strike ladder.
The morning’s forty-minute exit stays outside the rulebook: no rule sets how close to its target a winner has to run.
2. Moving the Stop Away
Mid-afternoon, the NZD/USD short is down $200 with the stop at minus $250. Your jaw is tight. You drag the stop to minus $450; $450 is still under 1% of the account, you reason. When price leans on the new line, the second drag, to minus $800, takes less than a second. Twenty minutes later you close by hand at minus $650: 2.6R on a trade budgeted at 1R.
Each drag bought more time before the open loss became a booked line in the balance, and loss aversion will pay a lot for that time. The price showed up in the loss-if-hit, which climbed from $250 to $450 to $800 (1.6% of the account). At $800, the +$500 target paid less than two-thirds of the risk on a setup planned at two to one.
A stop kept only in your head gives way even sooner, as our piece on the mental stop loss shows.
FundingTraders’ Outsized Risk rule draws its line where a trade idea’s planned risk to the stop tops 2% of account size, $1,000 here. At minus $800 the stop sat $200 inside it, so one more drag would have taken the planned risk past the 2% line. Deleting the stop instead would point at a different pattern: on funded accounts, trading without a stop-loss can bring a hygiene strike once half or more of a payout period’s closed trades (minimum 10) end with no stop at exit.
3. Trading to Get It Back
You click close at minus $650 and the room goes quiet. The balance reads $49,550, and the first thought to arrive is a number, 650, and how quickly you could win it back. A USD/JPY chart you hadn’t opened all day is on the screen before you’ve decided to look, and a bigger position would cover the hole in one move.
This leak is the quickest, and it feeds on the one before. A loss stretched to 2.6R hurts more than the planned 1R, so the hunger for relief grows, and so does the size that seems reasonable. Winning back $650 on the usual 2R target means risking $325, 1.3 times normal; on a 1R move it means $650, 2.6 times normal. FundingTraders treats a rushed re-entry to recover a loss as a choice made under pressure, not from a plan.
Toxic Trading Practices backs that with a Revenge rule: close a trade down 0.5% or more of the account, and any new entry within the following 5 minutes, on whatever symbol, is a revenge trade. The minus $650 exit is far past that $250 line. The rule applies to funded accounts, and your evaluation history is reviewed against it when you reach the profit target.

4. Steering the Day Back to Zero
Say you leave the desk for those five minutes. You come back late in the afternoon to a session down $450, and you’ve done the sum without meaning to: minus $450 is 1.8R, so one ordinary 2R winner from here would turn the whole day green with $50 to spare.
This is the slowest leak, and loss aversion doesn’t need an open trade to run it. What makes zero so attractive is tonight’s journal: it will carry whatever total the day ends on, and zero is the one entry that needs no explaining, even to yourself. The chasing losses breakdown shows where that leads.
FundingTraders watches the far end of this habit. On funded accounts, a trading day that gets within half a percent of the product’s own daily loss limit counts toward Overexposure, and three such days in any rolling 30-day window bring the flag. With an illustrative 5% daily limit, the limit itself would be $2,500 on this account (limits vary by product). It’s a coaching flag: it can push an account up the strike ladder but carries no payout deduction.
Adding Up the Session
When the session ends, go back to the moment both trades shared: $200 on the screen.
| Trade | At the $200 moment | What loss aversion did | Plan | Result |
|---|---|---|---|---|
| AUD/USD long | +$200 open (0.8R) | Closed it | +$500 (2R) | +$200 (0.8R) |
| NZD/USD short | -$200 open (0.8R) | Moved the stop, twice | -$250 (1R) | -$650 (2.6R) |
| Session | +$250 | -$450 |
Plan and result end $700 apart: $300 left behind on the green trade and $400 added to the red one, both starting from the same $200.
Run the R numbers and the cost of loss aversion in trading gets clearer still. Winning 0.8R and losing 2.6R, as a habit, pushes the break-even win rate to 2.6 / (0.8 + 2.6), about 76%: a little over three wins in four, past even the worst row of the ladder in leak 1, reached in a single session.
Why Pressure Favors the Quick Click
Pressure tends to shorten your time horizon. With money moving on an open position, the next hundred trades drop out of view, and whatever ends the discomfort soonest starts to look like the smart move. Banking a green trade, moving a stop and jumping into a recovery trade all end it fast; a written plan asks you to sit with it, so under stress, loss aversion tends to win.
Think of grocery shopping on an empty stomach. Nobody fixes that by resolving to be tougher in the snack aisle; they eat first and shop from a list. The trading version of eating first: type both exits into the order ticket with the entry, and hand the next entry to a timer that starts when a loss closes. A bracket order is a list written on a full stomach.

5 Routines Against Loss Aversion in Trading
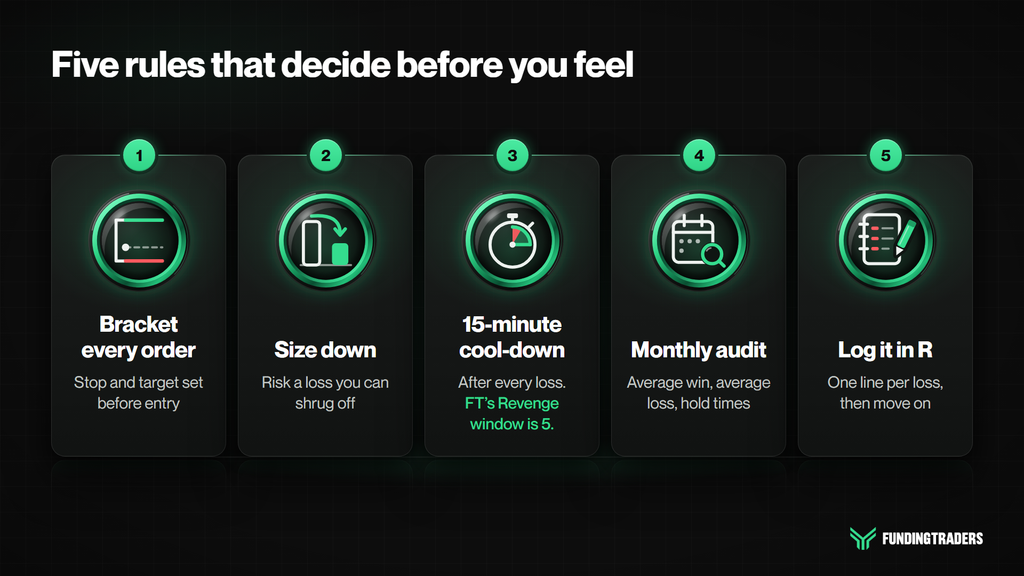
All but the monthly audit can start on your next trade, and none asks you to feel differently.
Bracket Every Order Before You Click
Before you click buy on AUD/USD, the ticket already carries a stop at minus $250 and a take-profit at +$500, and a line in your plan says neither moves once the order fills. The +$200 moment still comes, but the default has flipped. Reaching +$500 now asks nothing more of you, while taking $200 means clicking against an order already working in the platform.
The same rule keeps the NZD/USD stop at minus $250. Thinking at the order ticket and letting the orders do the waiting is the heart of set and forget trading. Once a funded account is under protective controls, after a risk review or a first strike, FundingTraders’ risk rules call for a stop-loss on each trade. Before that, it’s your call: the General Trading Guidelines don’t require one but highly recommend it as best practice. If loss aversion is your problem, treat it as compulsory.
Size Down When Your Hands Start Moving
The trigger lives in your journal, not your mood: one moved stop or one early exit in the last week sends your risk per trade to half. On this account 0.5% becomes 0.25%, so a full stop-out costs $125. Facing a $250 stop-out was enough to start dragging the NZD/USD stop; $125 is a smaller thing to defend, and that alone can keep your hands off the order. Stay there until 20 trades in a row pass with both exits untouched, then step back up.
At 0.25%, the morning’s +$200 would have read +$100 and the afternoon’s minus $200 just minus $100: smaller figures to guard in the green and to chase or avenge in the red. For scale, Risk Management at FundingTraders puts the usual expert advice at 1.5% or less per trade idea, and Toxic Trading Practices points lower, to about 1%.
Leave the Desk for 15 Minutes After a Loss
FundingTraders’ Revenge window only opens after a loss of 0.5% or more, and it shuts at minute five. The pull to win back $650 outlasts that and follows small losses too, so this timer runs 15 minutes and starts with every loss. The moment the NZD/USD trade closes at minus $650, you shut the platform and start the clock.
Time the break with a kitchen timer or a watch rather than your phone, which keeps the charts one swipe away, and spend it somewhere the screen isn’t. When the timer goes off, the first job is a one-line entry in your loss log (the last fix below), not a fresh chart. If the USD/JPY setup still looks good after that, you’ll meet it with a slower pulse.
Audit Your Averages Once a Month
The session left one more clue on the clock: the winner was closed forty minutes in, while the loser stayed open for most of the afternoon.
On the first trading day of each month, copy three figures from last month’s trade history into your journal: average win in R, average loss in R, and the average hold time of winners next to losers. The first two go into the break-even formula from leak 1, next to your actual win rate. The third puts that clue on a monthly scale, where losers outlasting winners means loss aversion is timing your exits.
There’s more on reading that gap in our article on holding losing trades. On a funded account, the Clarity Desk adds a check on the deleted-stop version of leak 2: its risk hygiene section shows SL at close (the portion of closed trades still holding a stop at exit, with a count of unprotected trades) next to win rate.
Log Every Loss in R, Then Move On
Once the 15 minutes are up, the NZD/USD trade gets one line in your journal: “NZD/USD, 2.6R, no, moved stop.” Every loss gets the same format: the pair, the R lost, whether the plan was followed and, if it wasn’t, what broke it. A clean stop-out on another pair reads “EUR/USD, 1R, yes.” Read the line aloud once, exactly as written, then close the journal.
Written in R, a planned loss reads as exactly what the order ticket gave it: 1R, not a dollar figure to brood over. A strategy with a 1R stop and a 2R target is built to lose some of the time, and each 1R line is the price of running it. The “no” lines are the useful ones: when one pair keeps collecting them, you’ve found where loss aversion grips hardest.
At month end, hand the “no” lines to the audit in the previous fix: their reasons show which of leaks 2 to 4 loss aversion has been using most.
Frequently Asked Questions
What is loss aversion in trading?
Loss aversion in trading is the tendency to feel a loss more sharply than an equal gain, roughly twice as strongly in Kahneman and Tversky’s work, and to let that weighting overrule decisions the plan already made. It shows up as winners closed early, stops moved further away, rushed re-entries and red days steered back toward break-even.
Does loss aversion only affect when you exit?
No. The best-known trace of loss aversion is the disposition effect, the habit of selling winners too soon and holding losers too long. But the same weighting keeps working once a trade has closed, which is where revenge entries and break-even chasing come from.
How can I tell if loss aversion is hurting my results?
Check your trade history for four signs: winners closed well short of target, losses that end past 1R, new positions opened within minutes of a loss and red days that finish close to the daily limit. Signs that recur month after month point to loss aversion overruling your plan.
Which FundingTraders rules can loss aversion run into?
Four of them, all on funded accounts. Dragging a stop raises a trade idea’s planned risk, and Outsized Risk draws its line at 2% of account size. Any position opened in the 5 minutes after a loss of 0.5% of account size or more is a revenge trade, whatever the symbol. A hygiene strike can follow when at least half of a payout period’s closed trades (minimum 10) end with no stop at exit, and days that come within half a percent of the daily loss limit count toward Overexposure. Evaluation histories are reviewed when the profit target is reached.
How much should I risk per trade to keep loss aversion in check?
There’s no single right number, and nothing here is personal advice. FundingTraders’ Toxic Trading Practices offers a rule of thumb near 1% of balance per trade idea, and its Outsized Risk rule draws its line where planned stop-loss risk tops 2% of account size. The practical test is simple: the right size is one where you’d let a full stop-out happen without touching the order.
Let the Rules Carry the Fear
Back to late morning and the AUD/USD long, entered this time as a bracket. At +$200, loss aversion in trading repeats its usual offer: take the $200 now. The offer goes unanswered: the stop waits at minus $250, the take-profit typed in at entry sits at +$500, and hours later the trade closes at the target without another click.
That’s the $300 the session left behind, kept by an order placed with the entry. Tonight, write your bracket rule for tomorrow: for every setup, a stop and a take-profit in dollars and R, decided before entry. Enter both with each order and walk away from the screen. If a trade closes at the stop, start the timer, then give the loss its one line in R.

Disclaimer: Trading involves significant risk and is not suitable for every investor. Past performance is not indicative of future results. The information provided in this article is for educational and informational purposes only and should not be considered financial, investment, or trading advice. All account rules, payout structures, profit splits, and promotional offers described in this article are subject to change at the discretion of FundingTraders. Promo codes may expire or be modified without prior notice. Always trade responsibly and only risk what you can afford to lose.